My Doctor Might Prescribe Teva, but Would I Prescribe the Stock?
Let's get a technical take on the health of the pharma play.
You've reached your free article limit
You've read 0 of 1 free Pro articles.
I have been seeing a lot of doctors lately. This is no borscht belt joke. Each visit means my medicines are getting tweaked or changed.
What is an analyst and a patient to do?
I'm checking out the charts of Teva Pharmaceutical Industries Limited TEVA.
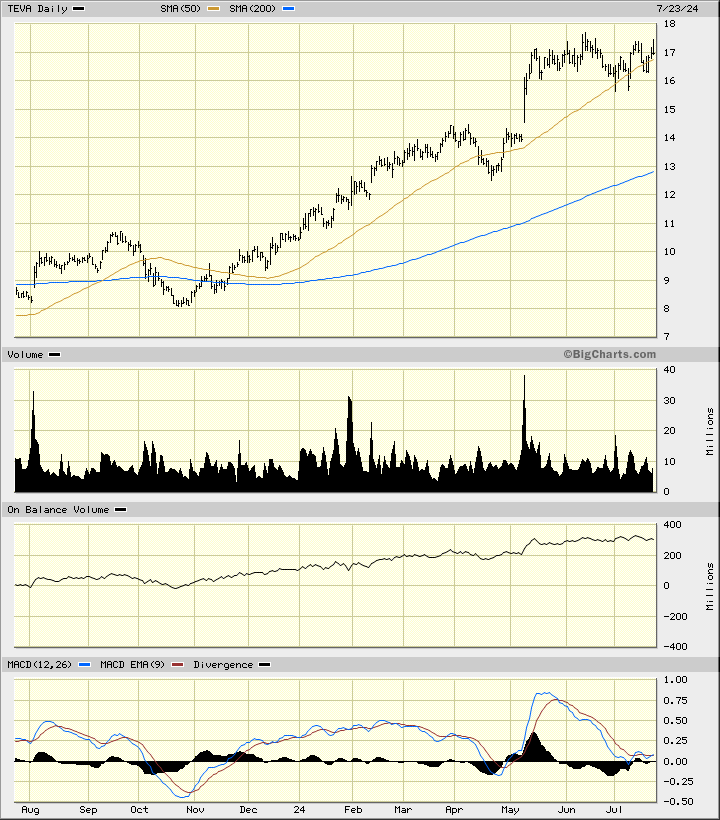
In this daily bar of TEVA, below, I can see that prices have more than doubled since October. The slopes of the 50-day and 200-day moving average lines are positive. The trading volume has been more active so far this calendar year.
The On-Balance-Volume (OBV) line has been on an upward path telling me that buyers of TEVA are being more aggressive than sellers. The Moving Average Convergence Divergence (MACD) oscillator is above the zero-line after a correction lower.
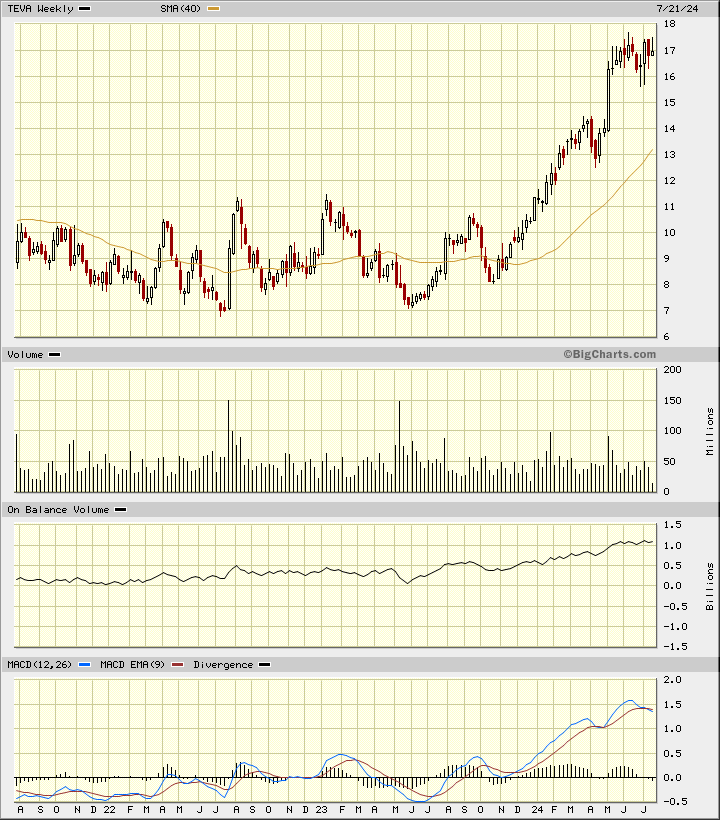
In this weekly Japanese candlestick chart of TEVA, below, I can see how prices made a base pattern for at least two years before launching an uptrend in October. (If you look at the Point and Figure charts below you can see that the base began in 2019.) Prices trade above the rising 40-week moving average line. The weekly OBV line is pointed upwards and the MACD oscillator is in a bullish alignment above the zero-line.
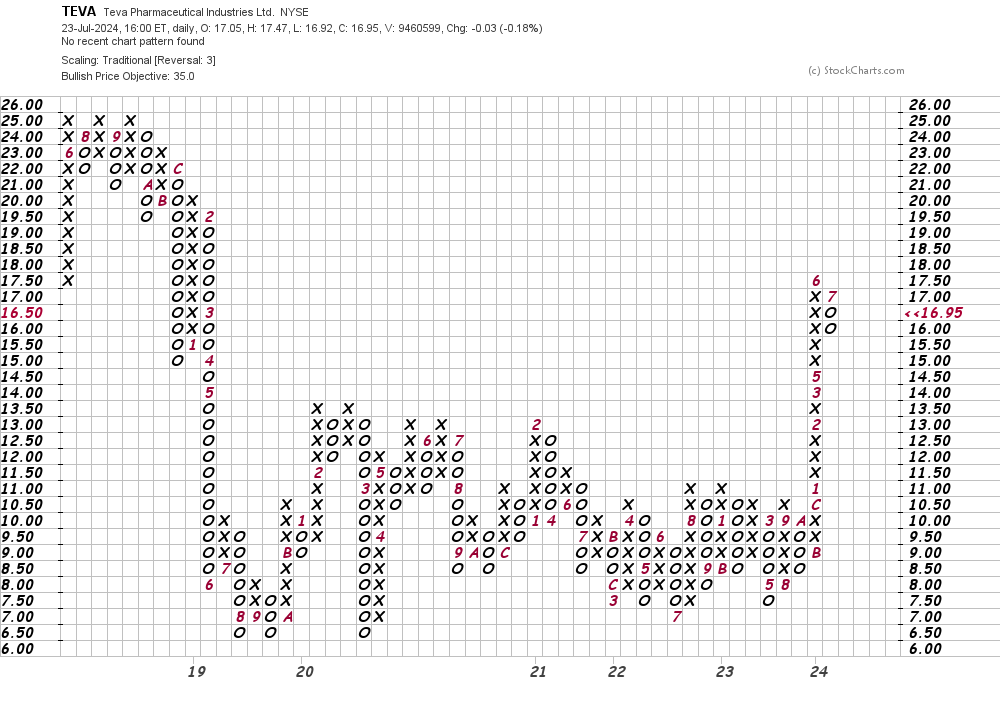
In this daily Point and Figure chart of TEVA, below, I can see a price target in the $35 area.
In this weekly Point and Figure chart of TEVA, below, I can see the same $35 price target as the daily chart above.
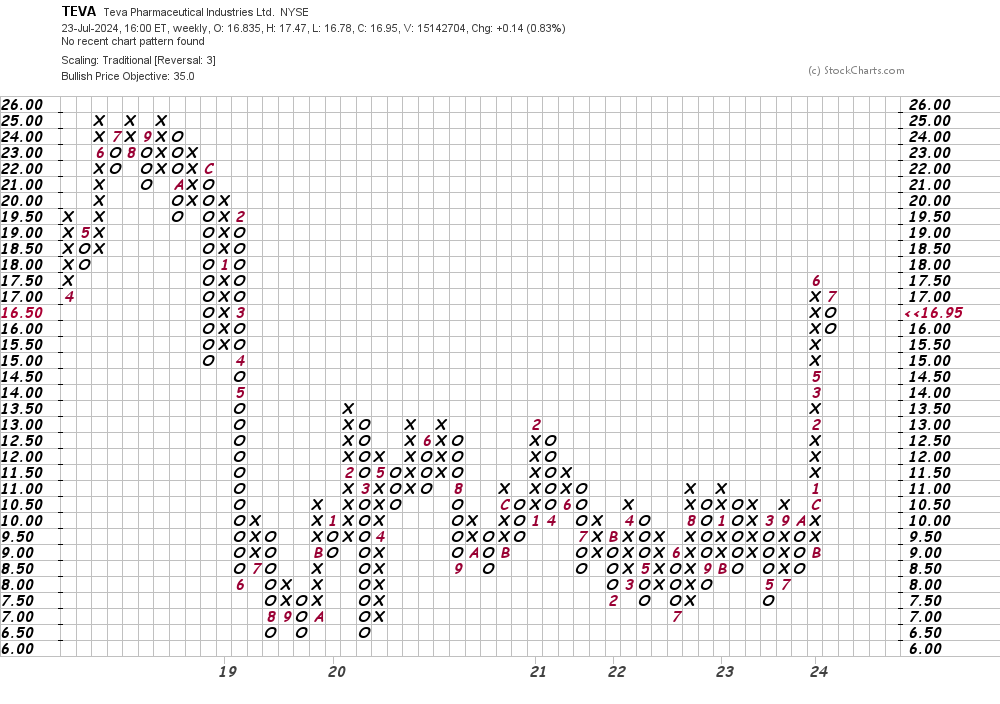
Bottom line strategy: Traders could go long TEVA in the $17-$16 area risking to $15. On the upside my price target is the $35 area.
Employees of TheStreet are prohibited from trading individual securities.