Target Still Has a Circle on Its Back
Does the latest price target reduction make sense?
You've reached your free article limit
You've read 0 of 1 free Pro articles.
Sell-side firm Stifel Financial SF sees weakness in the consumer and the firm lowered its price target for retailer Target TGT to $147 per share from $170.
Let's check out the charts and indicators for the retailer.
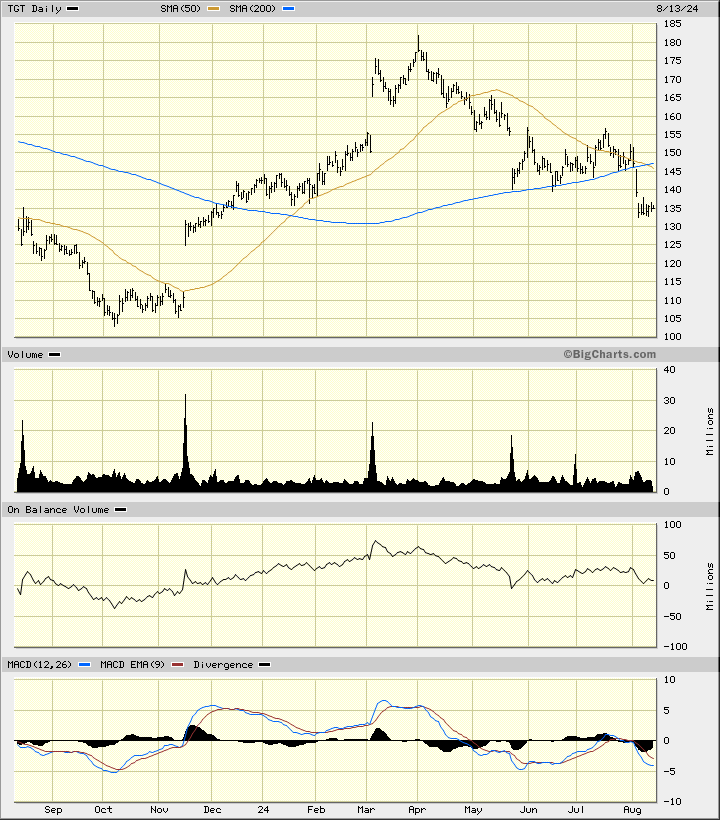
In the daily bar chart of TGT, below, I can see a bearish setup. The shares are trading below the declining 50-day moving average line and below the 200-day line.
The On-Balance-Volume (OBV) line peaked before prices did in early March. The OBV line has been trending lower telling me that sellers have been more aggressive than buyers. The Moving Average Convergence Divergence (MACD) oscillator is in a bearish alignment below the zero line.
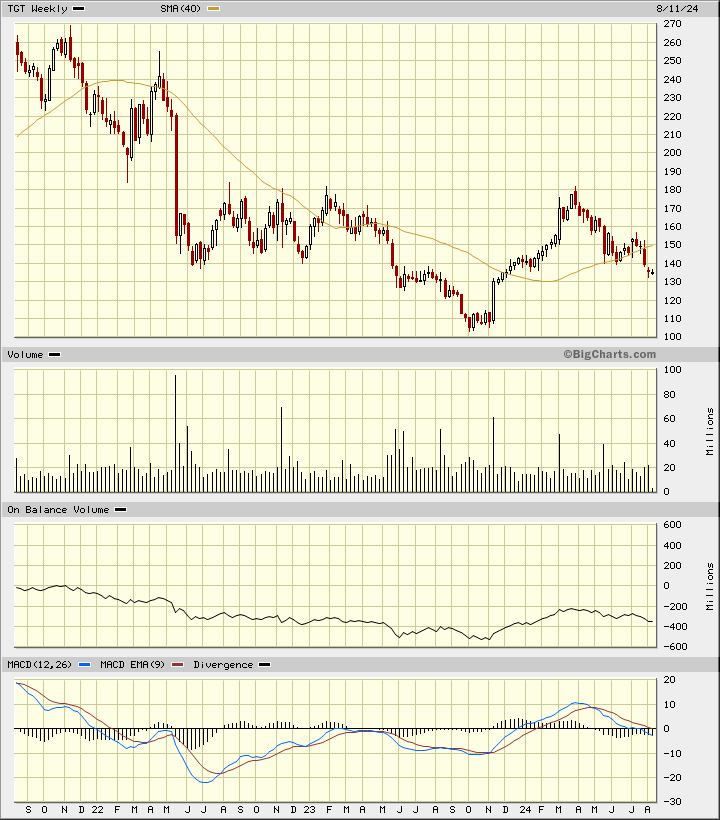
In the weekly Japanese candlestick chart of TGT, below, I see a bearish-looking chart. Prices trade below the 40-week moving average line.
The weekly trading volume has been declining for a while now telling me that investor interest is lacking. The weekly OBV line has weakened since March. The MACD oscillator has moved below the zero line for an outright sell signal.
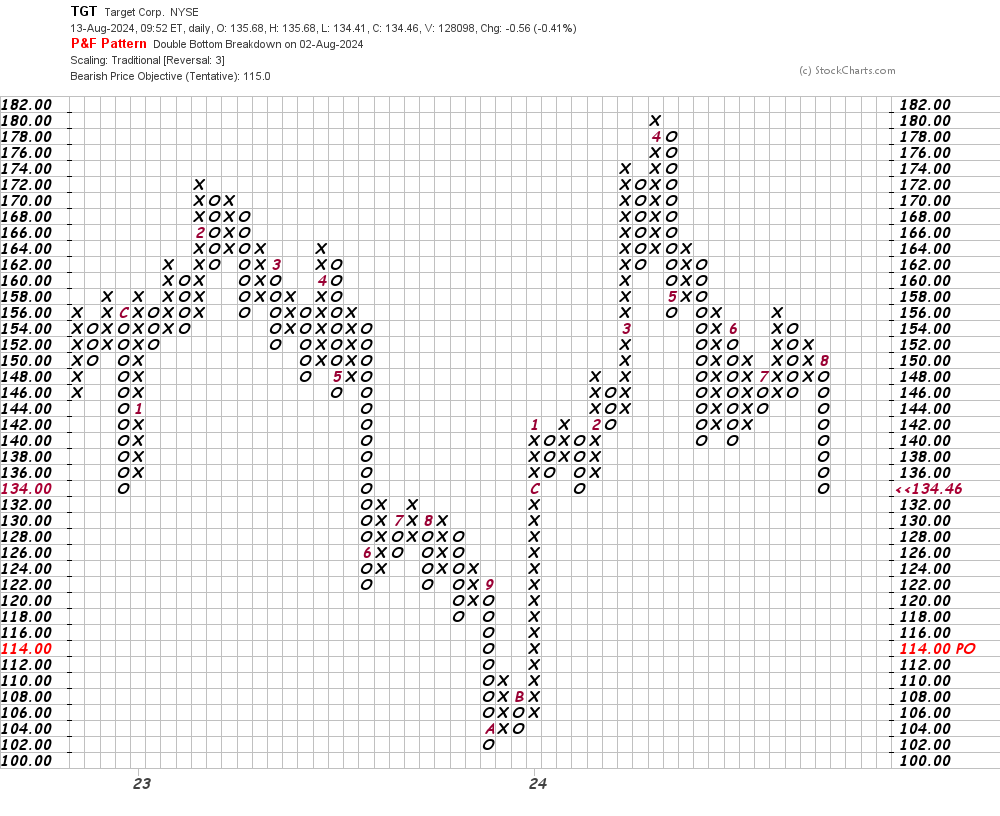
In this daily Point and Figure chart of TGT, below, I can see a downside price target in the $115 area.
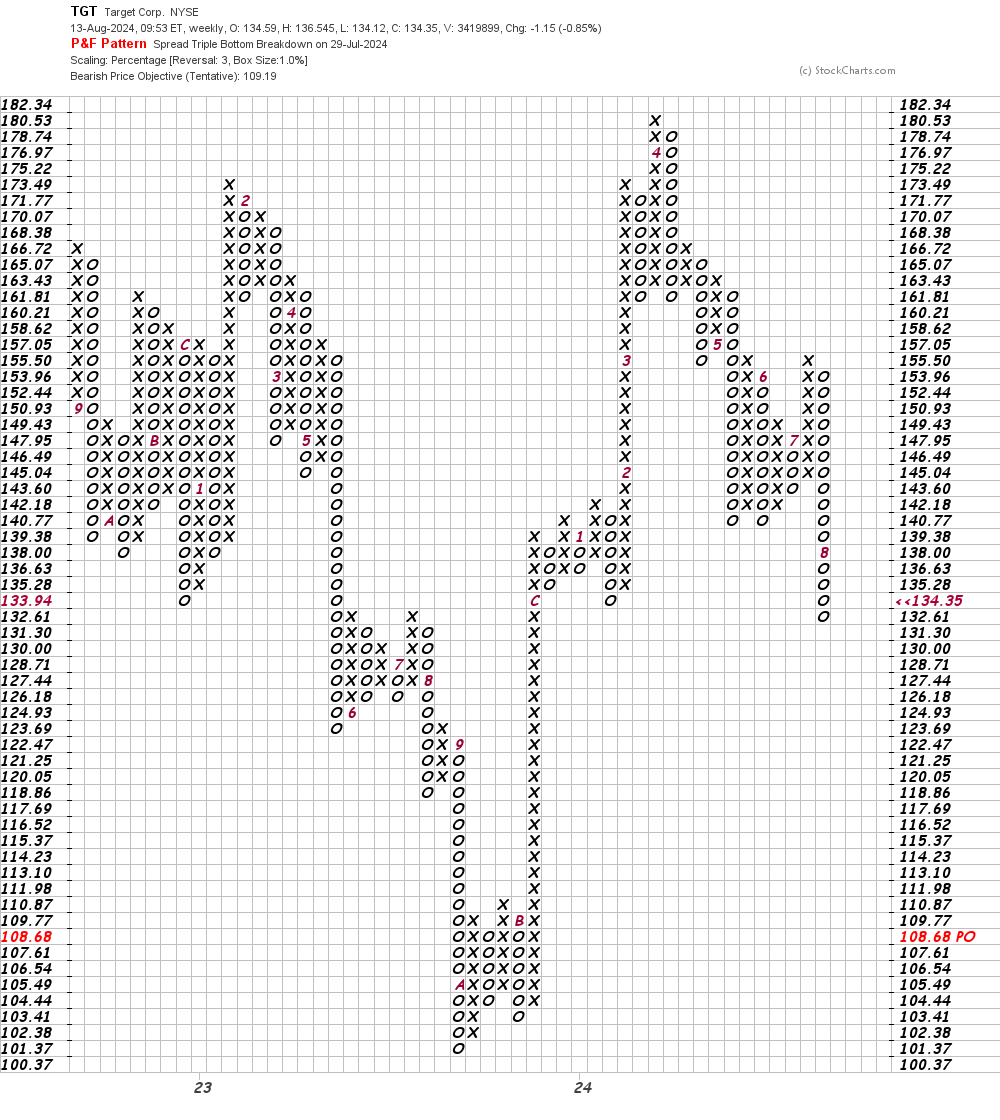
In this weekly Point and Figure chart of TGT, below, I can see a potential downside price target in the $109 area.
Bottom-line strategy: TGT looks like it is making a bear flag pattern on the daily bar chart. This is a continuation pattern and I look for TGT to continue its downtrend. Avoid the long side of TGT.
Employees of TheStreet are prohibited from trading individual securities.