Here's Where I'm Buying SoFi as Shares Approach Golden Cross
Following a major announcement, one technical indicator for SoFi has become about as bullish as it can get.
You've reached your free article limit
You've read 0 of 1 free Pro articles.
It's been more than a month since we've updated SoFi Technologies SOFI and, given that it was one of the "Stocks Under $10" core positions and still is one of mine, I figured that, in case I lose power, we had better run an update piece. Especially given that the stock had sold off and rallied over the past month.
On September 6, the last time I touched on this name, the last sale was $6.96. On Wednesday morning, SOFI is trading around $8.55. Though the name has been volatile, this morning's highs are the highs for this stock since this past March.
New Announcement
SoFi Tech announced that the firm had rolled out two new credit cards, one aimed at those who prioritize earning rewards and the other targeted at those more interested in improving their credit scores.
The "SoFi Everyday Cash Rewards" card will feature 3% unlimited cash back on dining out and on food delivery, 2% cash back on groceries and 1% cash back on all other eligible purchases. The "SoFi Essential" card will provide a credit line to those seeking to improve personal credit scores. There will be no surprise fees, no annual fees and no foreign transaction fees.
Earnings Coming
SoFi is expected to report on October 29, in less than three weeks. Wall Street is looking for a GAAP EPS of $0.04 on revenue of $632 millions. If these numbers are realized, this will be the firm's fourth consecutive quarter of profitability, while reflecting revenue growth of 19%. Of the nine sell-side analysts I know of who follow this stock, all nine have increased their Q3 earnings estimates for this name since the third quarter started.
The Technicals
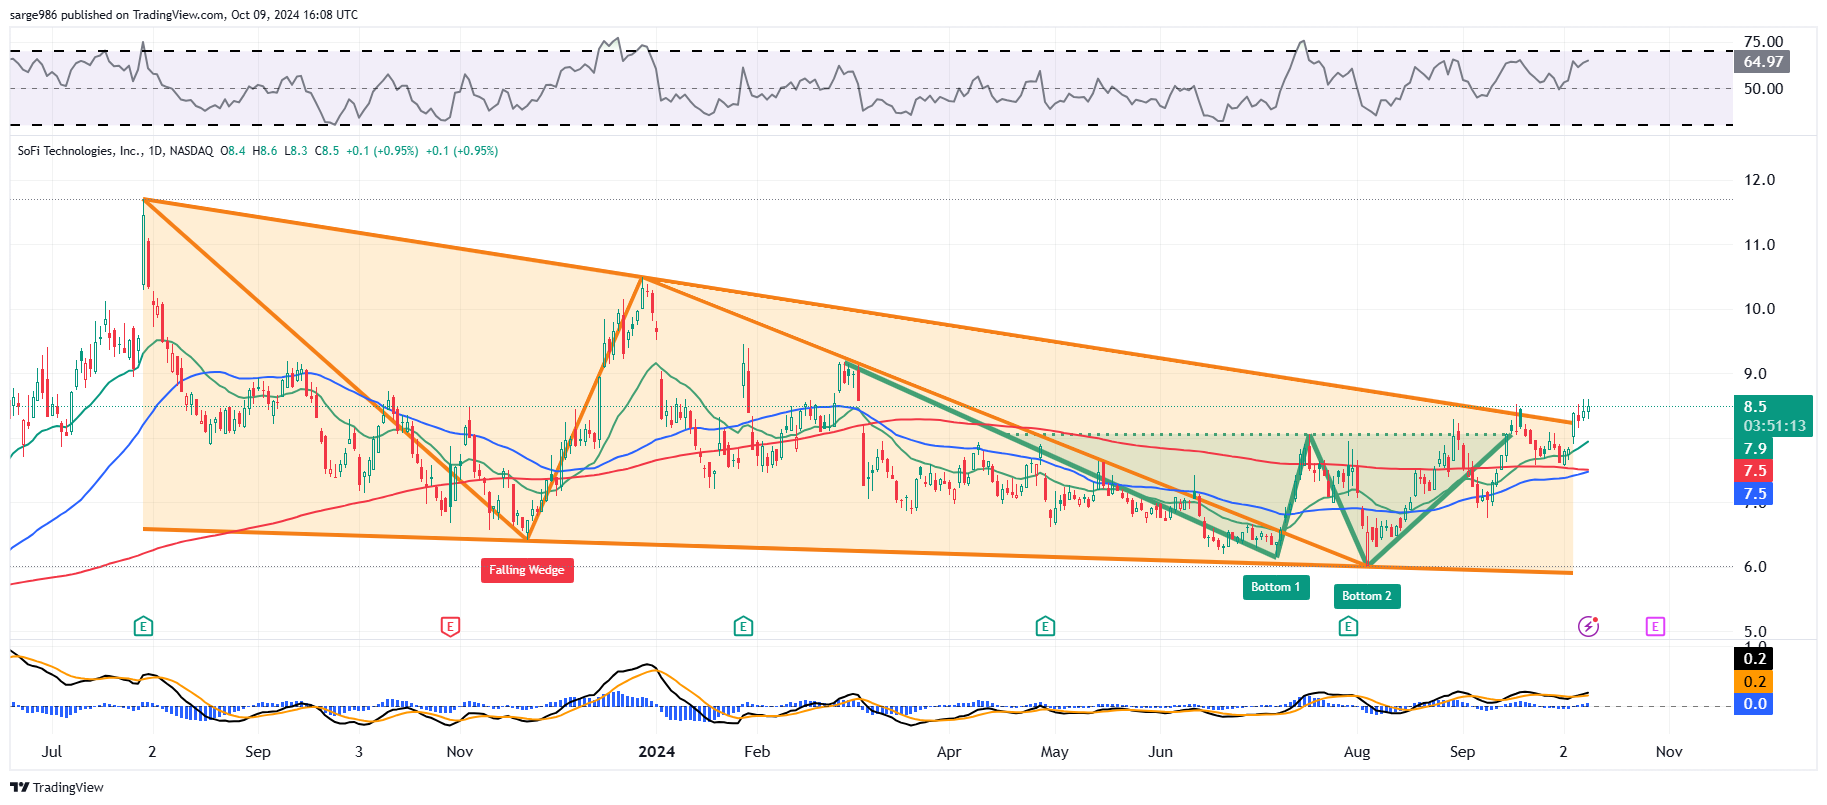
This chart is not that much of a change from the one I showed readers a month ago. The main difference is that now, both possible pivot points that one might draw from these patterns have been triggered. The double-bottom pattern (green) with an $8.06 pivot, which is the one I gave you in early September, and the $8.30 pivot created by the falling-wedge pattern of reversal (yellow).
The stock survived a test of its 50-day SMA at that time and has also retaken its 200-day SMA. Readers will also see that both the 50-day SMA and 200-day SMA are running at $7.50, therefore setting up an imminent "golden cross."
Currently, the reading for relative strength is strong, but not overbought, while the daily MACD is just where I like to see it. That's with the 12-day EMA having moved above the 26-day EMA with both of those lines and the histogram of the nine-day EMA in positive territory. All without being extended. That's about as bullish as a MACD gets in my book.
Target Price, Pivot, Panic
- Target Price: $10.25 (reiteration)
- Pivot: $8.30 (up from $8.06)
- Add Some: Down to 50-day SMA (currently $7.50)
- Panic: On a loss of both the 50-day and 200-day SMAs
At the time of publication, Guilfoyle was long SOFI equity.
