Taiwan Semiconductor Was Feeling Tremors Before the Earthquake
It looks like the price of Taiwan Semiconductor could pull back further.
You've reached your free article limit
You've read 0 of 1 free Pro articles.
A 7.4 magnitude earthquake impacted the island nation of Taiwan and Taiwan Semiconductor Manufacturing TSM. Small earthquakes are relatively common in Taiwan and I felt one when I was teaching technical analysis there back in 2007. Growing up in New Jersey the experience was unsettling. I guess Californians are used to it.
Stock prices are the result of what thousands of people think, believe or fear, so let's check the charts and indicators.
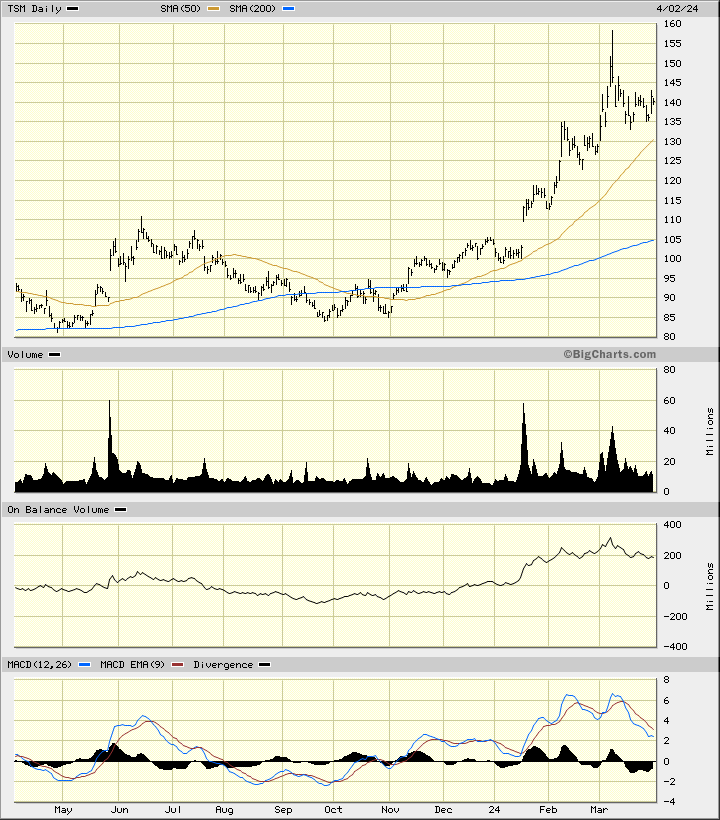
In this daily bar chart of TSM, below, I can see that prices have rallied smartly into a high in early March. Prices have been correcting that sharp rally in recent weeks ahead of the earthquake. Trading volume has been shrinking but prices have declined anyway suggesting that TSM is "falling of its own weight".
The daily On-Balance-Volume (OBV) line has turned lower suggesting that traders have shifted from being aggressive buyers to aggressive sellers. The Moving Average Convergence Divergence (MACD) oscillator has been in a correction in February and March but still stands above the zero line.
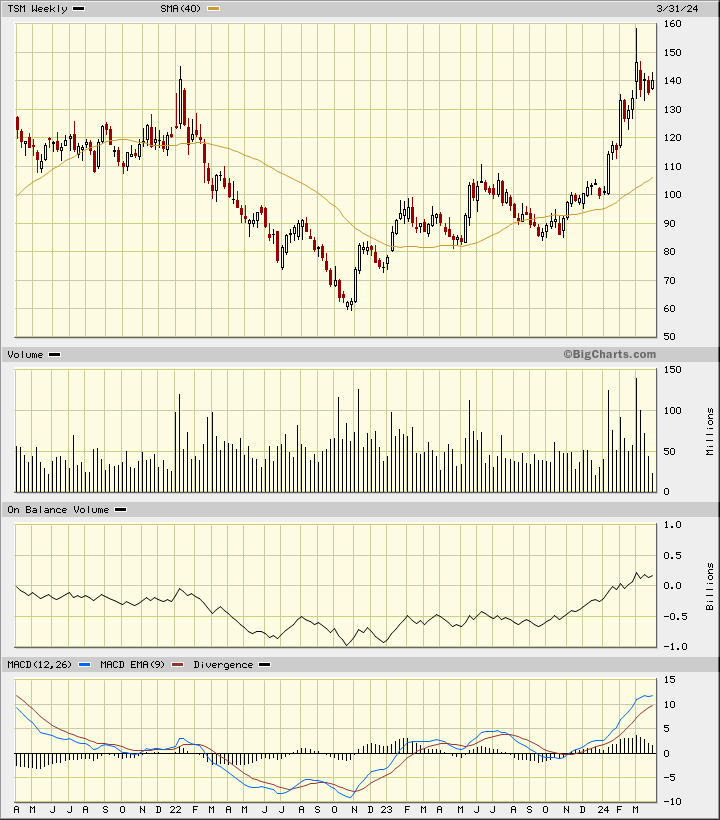
In this weekly Japanese candlestick chart of TSM, below, I can see a strong rally over the past seventeen months or so. Prices have more than doubled so there are probably some traders looking to "book profits". Prices trade above the rising 40-week moving average line.
The OBV line has been rising the past year but has leveled off in March. The MACD oscillator is above the zero line but it has narrowed in recent weeks telling me that the "trend strength" is weakening. All of these technical developments were going on ahead of the earthquake.
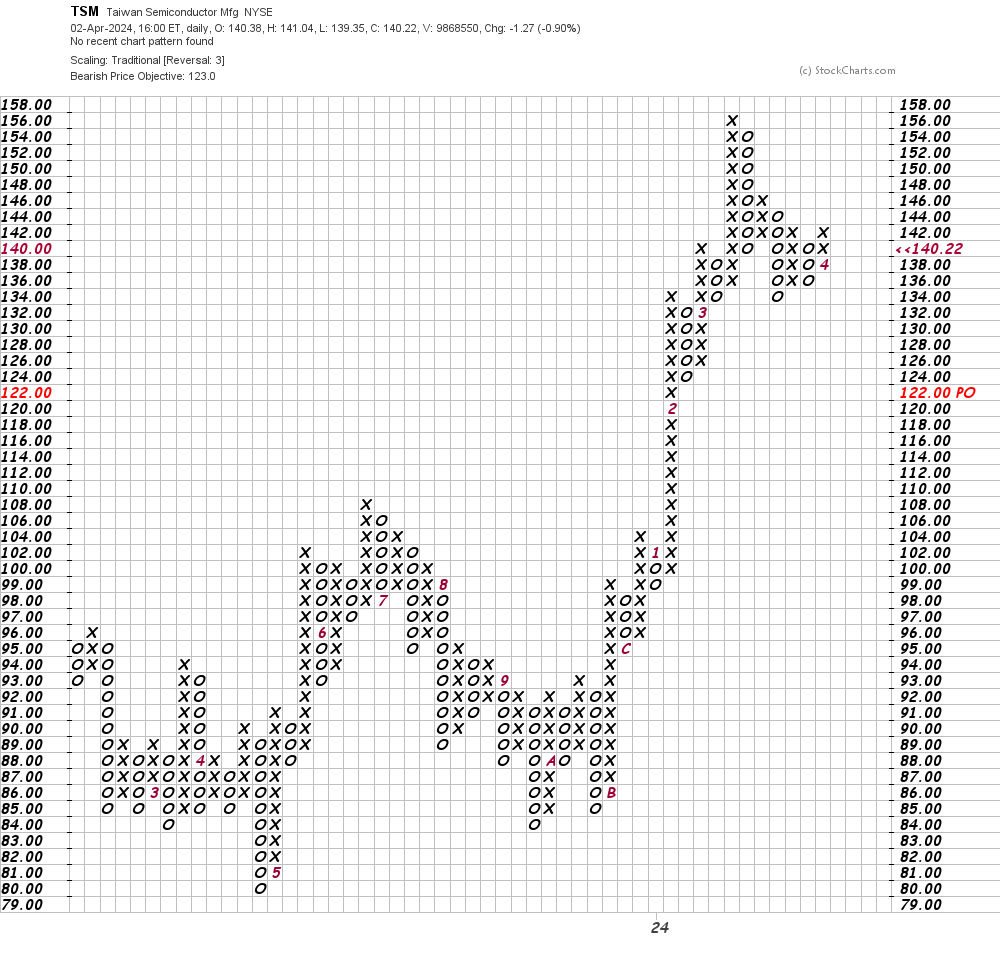
In this daily Point and Figure chart of TSM, below, I can see a potential downside price target in the $123 area.
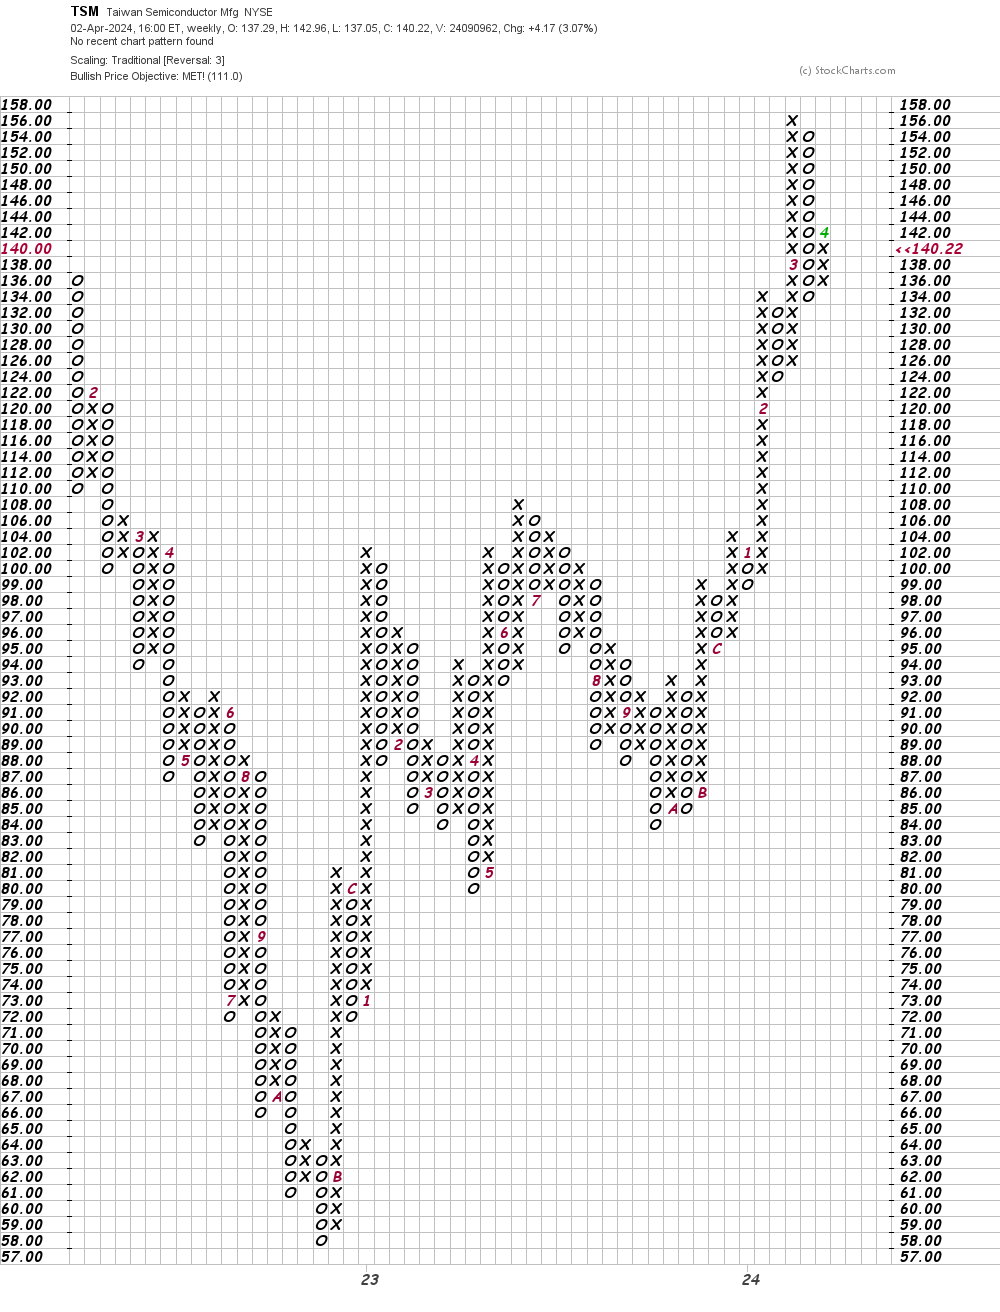
In this weekly Point and Figure chart of TSM, below, I can see that prices reached and exceeded a price target in the $111 area.
Bottom line strategy: The great earthquake in San Francisco was on April 18, 1906 and there is a great story about Jesse Livermore shorting the market before the quake. This is not the same situation but it looks like the price of TSM could pull back further in the days and weeks ahead.
Employees of TheStreet are prohibited from trading individual securities.