Super Micro Computer Has Started Its Downside Correction
How low could it go?
You've reached your free article limit
You've read 0 of 1 free Pro articles.
On March 11 I wrote about Super Micro Computer SMCI, telling subscribers that "The share price of SMCI is extended. It has soared to levels I cannot justify by technical analysis (maybe other technicians can do it, but not me). The charts have not made a top but prices can decline nevertheless. I would look for opportunities elsewhere."
SMCI is trading lower Tuesday on the heels of announcing an equity offering, so let's visit the charts and indicators again.
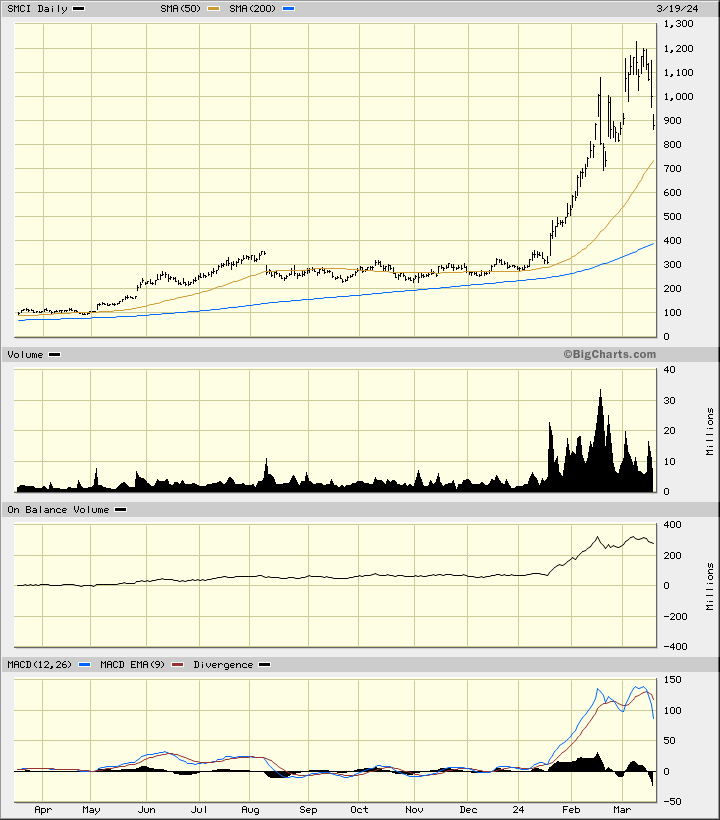
In this updated daily bar chart of SMCI, below, I can see that prices have tumbled lower and the gains of March have quickly disappeared. The most recent buyers of SMCI are feeling some pain and should be cutting their losses. Prices are still above the rising moving average lines but these are lagging indicators.
The On-Balance-Volume (OBV) line has started to turn lower, telling us that sellers of SMCI are becoming more aggressive. The Moving Average Convergence Divergence (MACD) oscillator has crossed to the downside for a take profit sell signal.
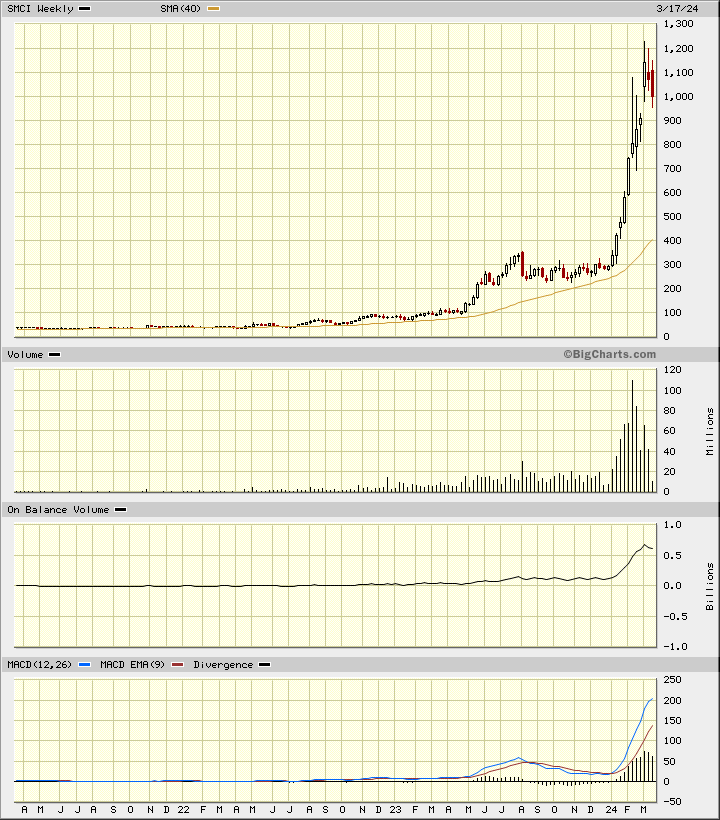
In this weekly Japanese candlestick chart of SMCI, below, I can see that the three most recent candles show us upper shadows which tells us that traders have rejected the highs.
Trading volume looks like it has peaked and the weekly OBV line has started to turn lower. The MACD oscillator has begun to narrow and that tends to foreshadow price weakness ahead.
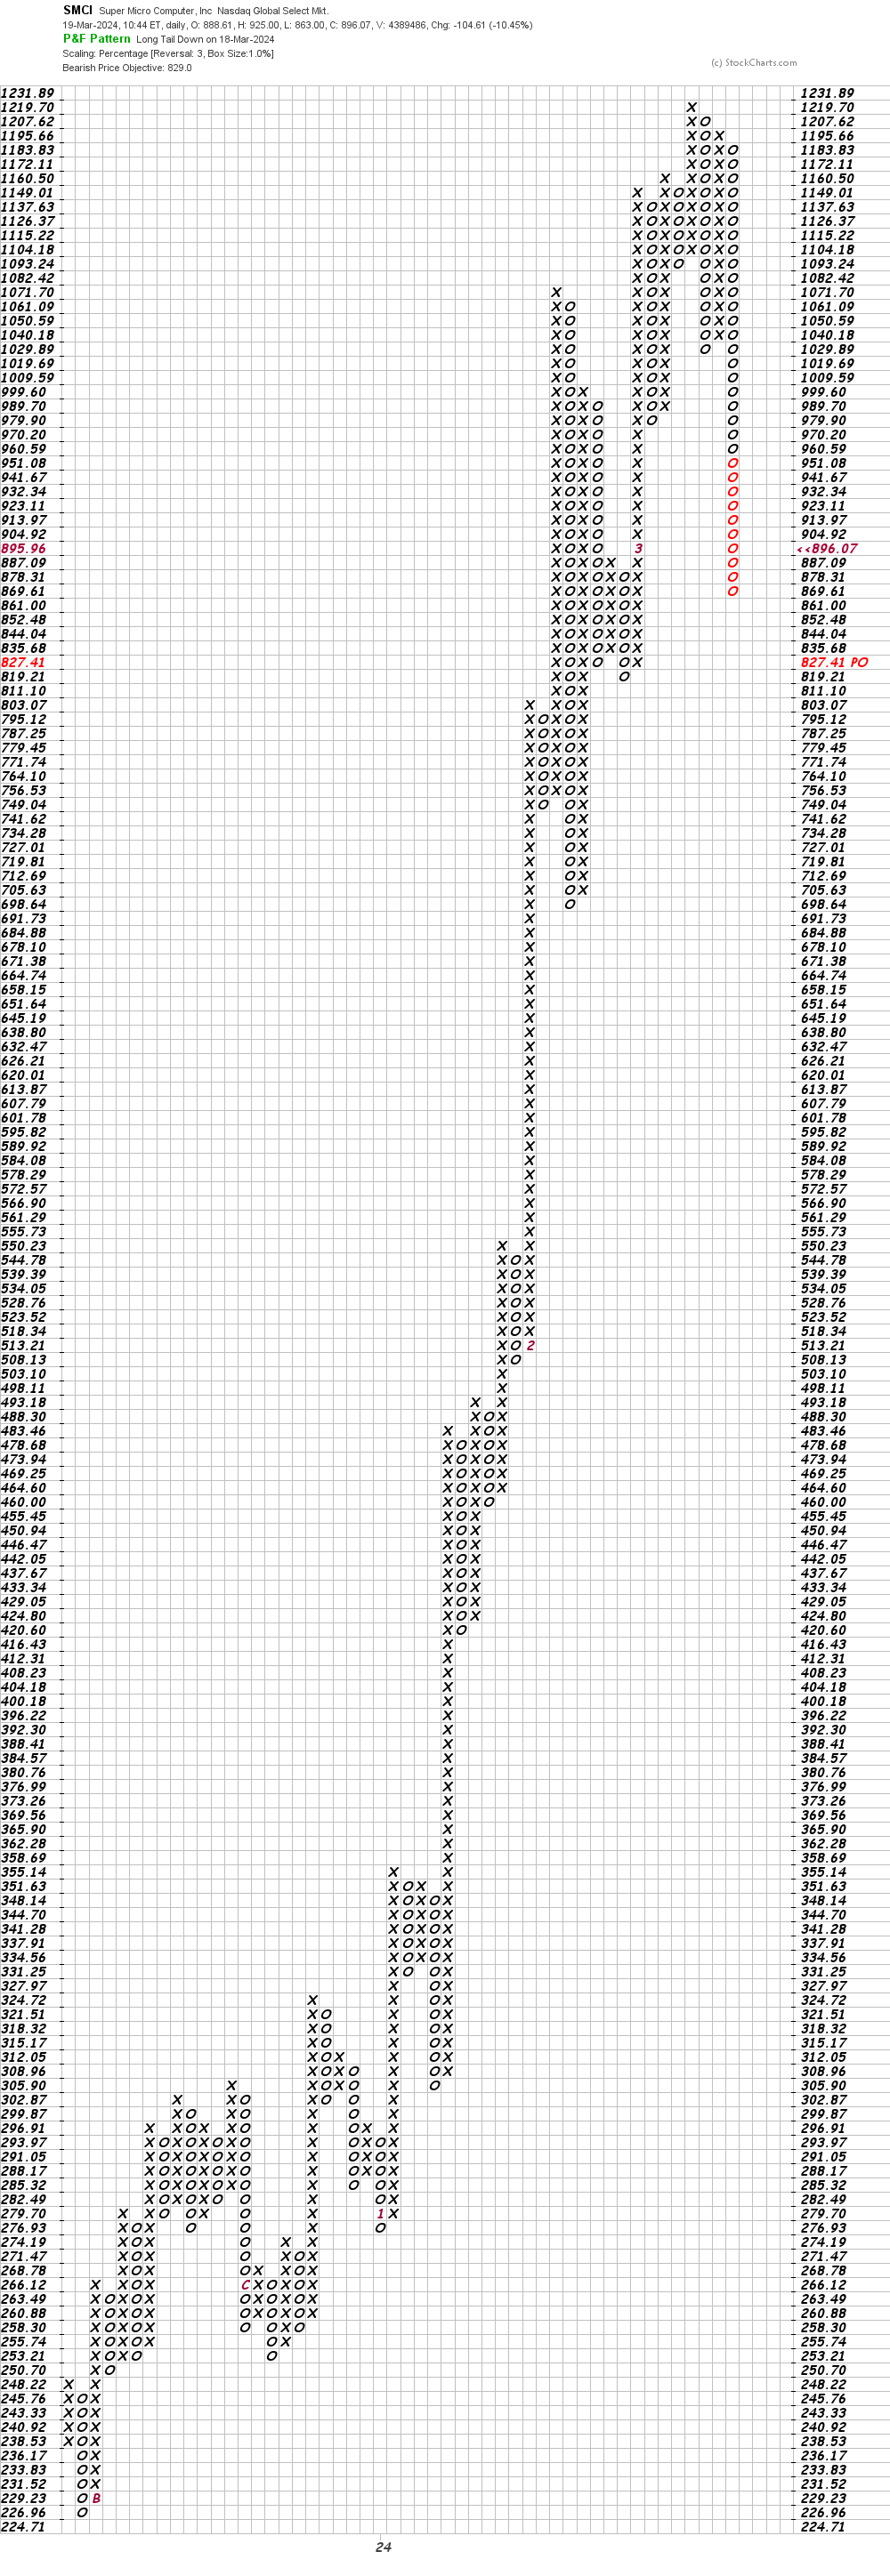
In this daily Point and Figure chart of SMCI, below, I can see a downside price target in the $829 area.
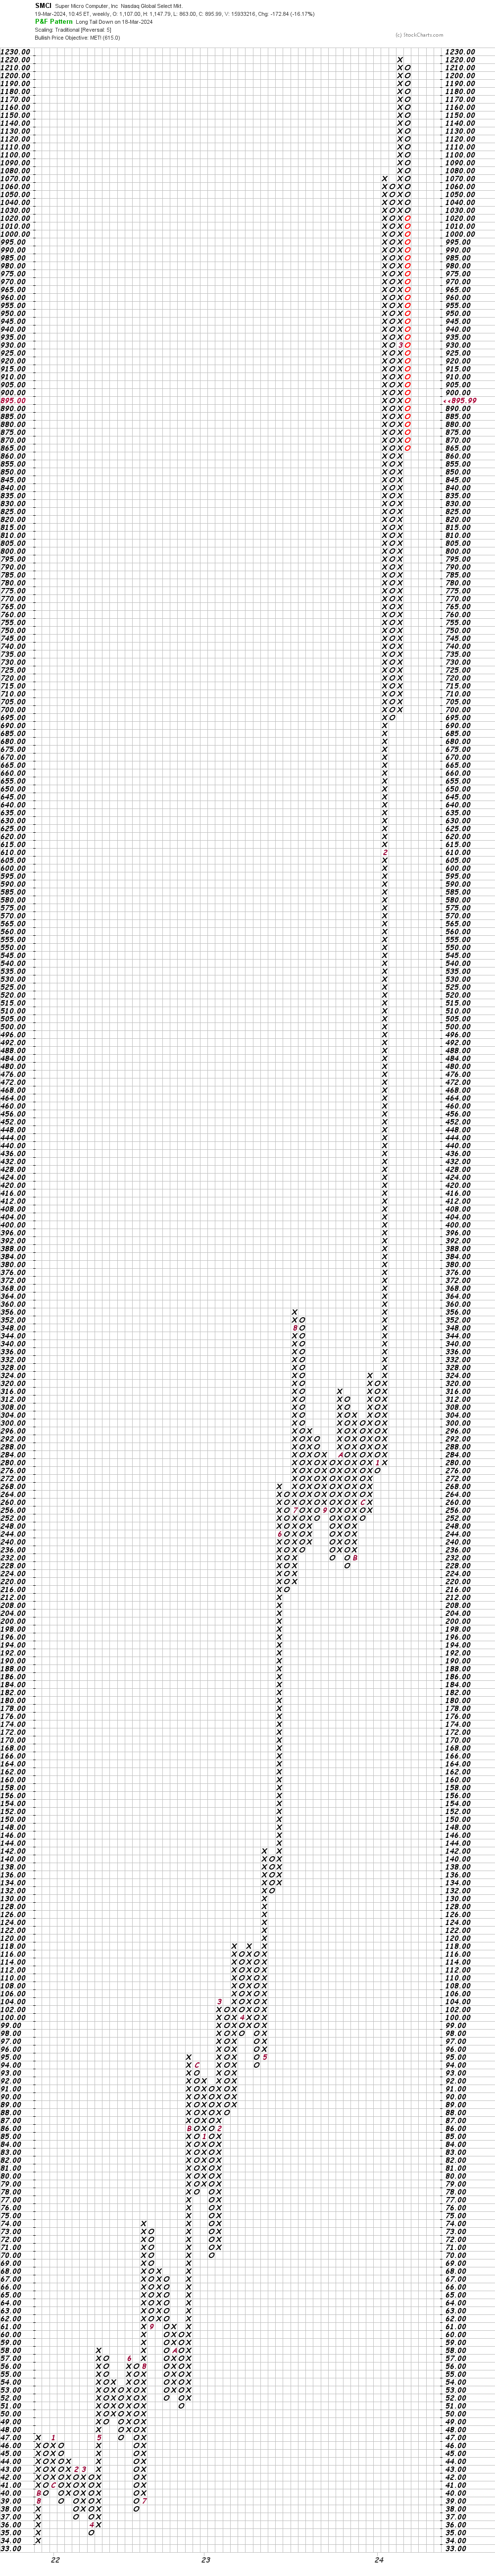
In this weekly Point and Figure chart of SMCI, below, I am waiting for the software to catch up to the price action and generate a downside price target.
Bottom line strategy: Prices may hold around the round number of $800 but I cannot rule out further declines. Keep your powder dry.
Employees of TheStreet are prohibited from trading individual securities.