Suncor Is Poised for an Upside Breakout
Here's my price target for now.
You've reached your free article limit
You've read 0 of 1 free Pro articles.
Suncor Energy SU produces "bitumen blends, gasoline, asphalt, diesel, sweet and sour crude oil, chemicals, heavy fuel and home heating oil, petroleum coke and Sulphur" - a bit more than what "energy" might imply.
Let's check out the charts and indicators of SU before they surge any higher.
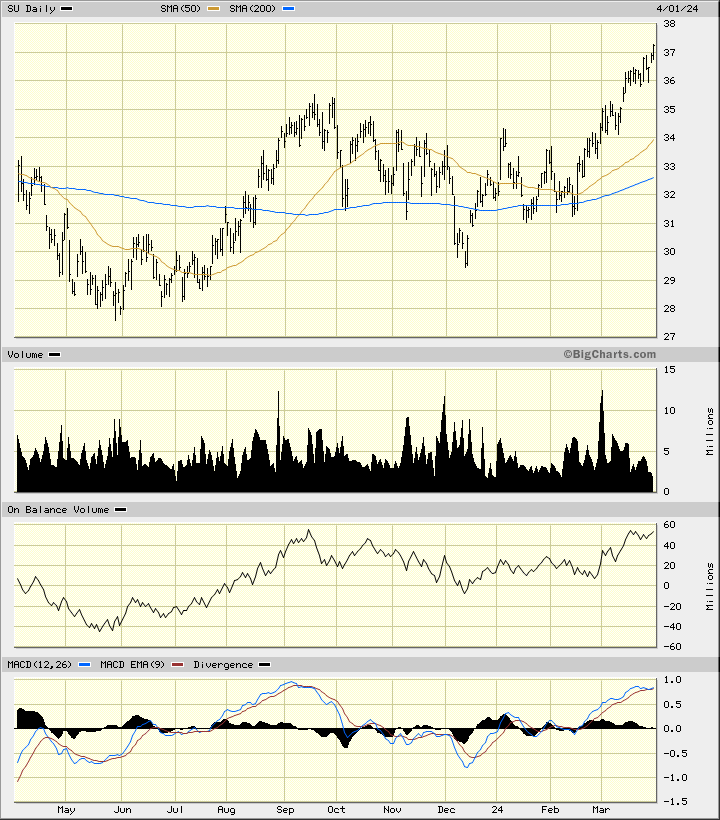
In this daily bar chart of SU, below, I can see that prices turned higher from February. SU trades above the rising 50-day moving average line and the rising 200-day moving average line. The trading volume has been choppy but active.
The On-Balance-Volume (OBV) line shows improvement from December and tells me that buyers of SU have been more aggressive than sellers.
The Moving Average Convergence Divergence (MACD) oscillator is above the zero line but it has narrowed and could soon cross to the downside for a take profit sell signal.
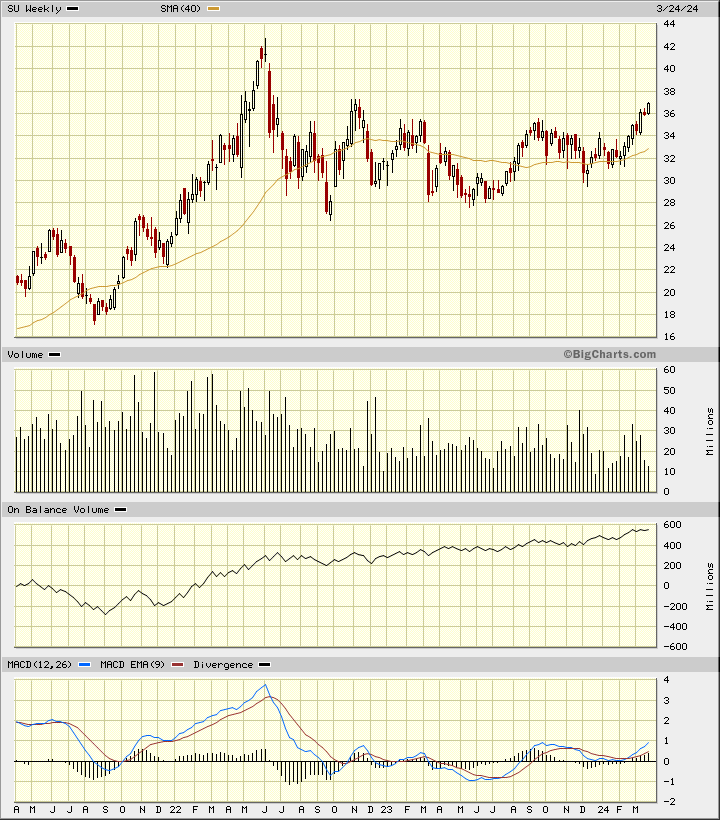
In this weekly Japanese candlestick chart of SU, below, I see a positive-looking setup. Prices have made a large consolidation pattern the past two years and are now poised for an upside breakout. SU trades above the rising 40-week moving average line. Trading volume remains active but down from the pace seen in 2021.
The weekly OBV line tells us a bullish story with its rise the past three years. The MACD oscillator is pointed up from above the zero line - a buy message.
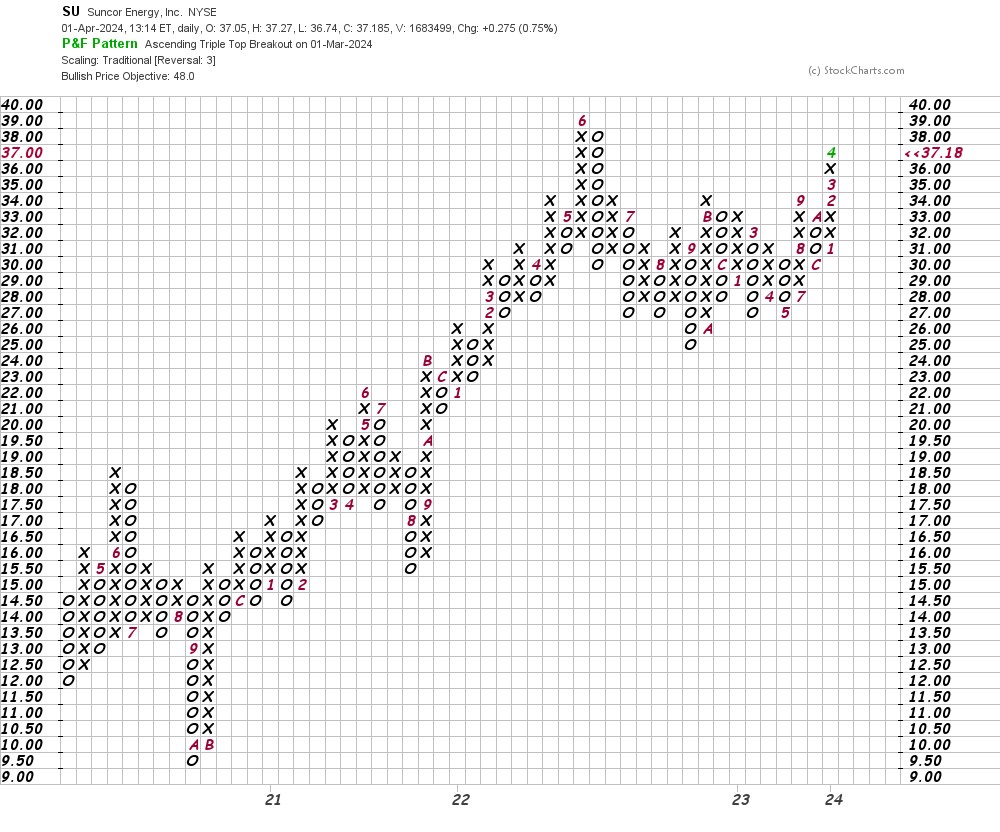
In this daily Point and Figure chart of SU, below, I can see an upside price target in the $48 area.
In this weekly Point and Figure chart of SU, below, I can see the same $48 price target as shown on the daily Point and Figure chart above.
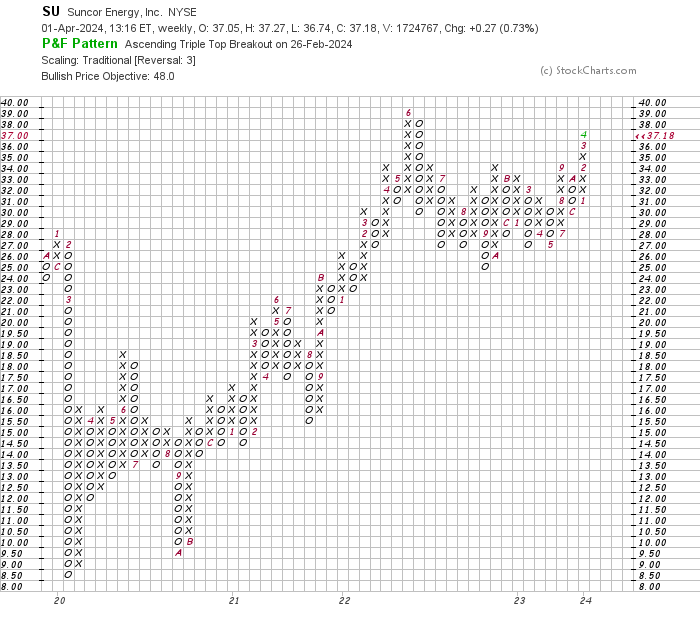
Bottom line strategy: Traders could go long SU on a dip towards $36.50 risking to $34. The $48-$51 area is my price target for now.
Employees of TheStreet are prohibited from trading individual securities.