Studying Up on Chegg Ahead of Earnings
Do the charts and indicators make the grade?
You've reached your free article limit
You've read 0 of 1 free Pro articles.
Chegg, Inc. CHGG is an education technology company that provides homework help, digital and physical textbook rentals, textbooks, online tutoring, and other student services. The company is set to report its latest quarterly results to shareholders after the close of trading Monday.
Let's check out the charts and indicators and see if they make the grade.
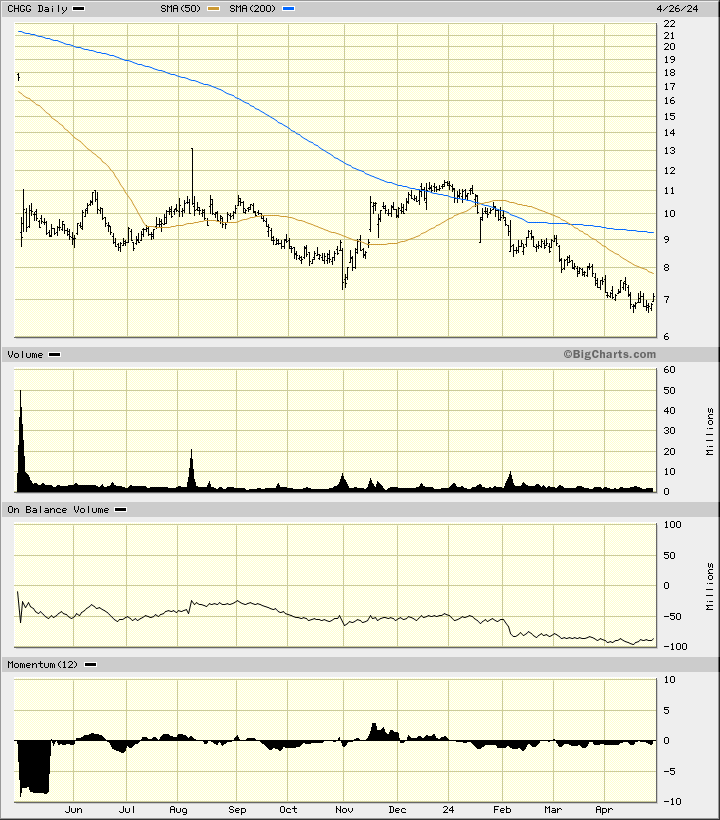
In the daily bar chart of CHGG, below, I used a log scale to display the price action. I can see that the shares are trading below the declining 50-day and the declining 200-day moving average lines. The trading volume has been steady and hard to "read."
The daily On-Balance-Volume (OBV) line has been in a downtrend. The 12-day price momentum study in the lower panel shows higher lows since February even though prices have made lower lows. This difference in movement is a bullish divergence.
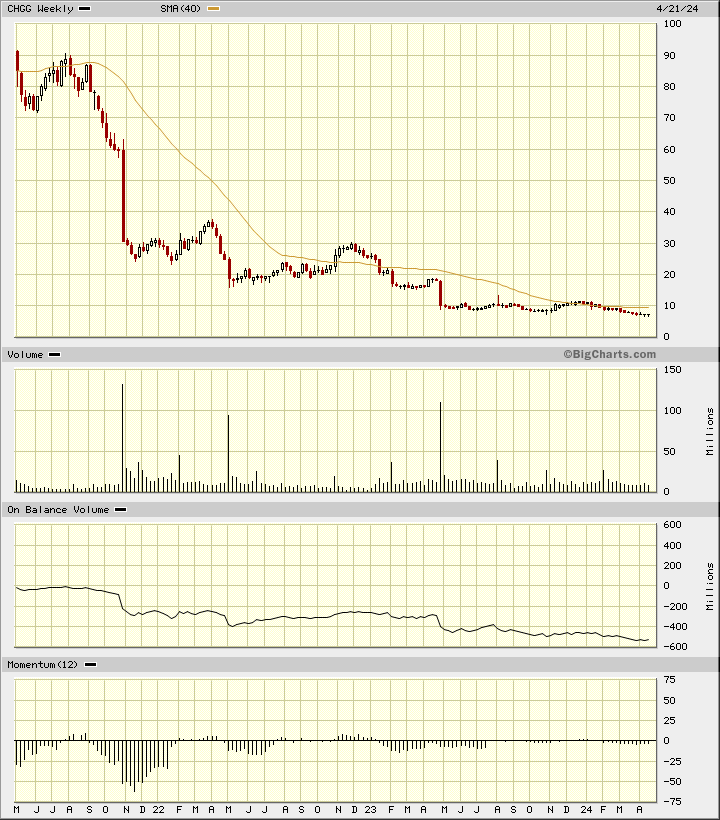
In the weekly Japanese candlestick chart of CHGG, below, I can see that the shares have declined sharply over the past three years. CHGG trades below the 40-week moving average line.
The weekly OBV line is bearish and the 12-week momentum study is hard to interpret.
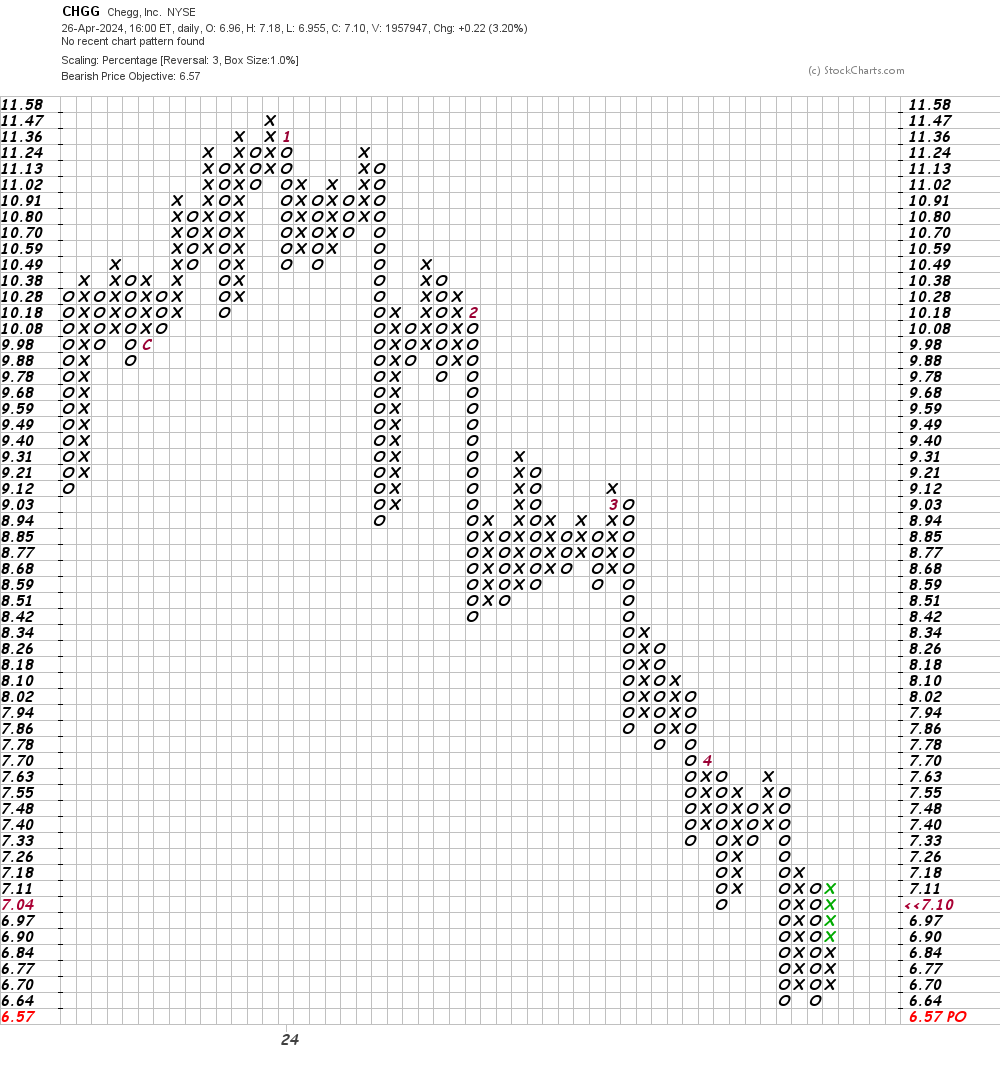
In this daily Point and Figure chart of CHGG, below, I can see a downside price target in the $6.50 area.
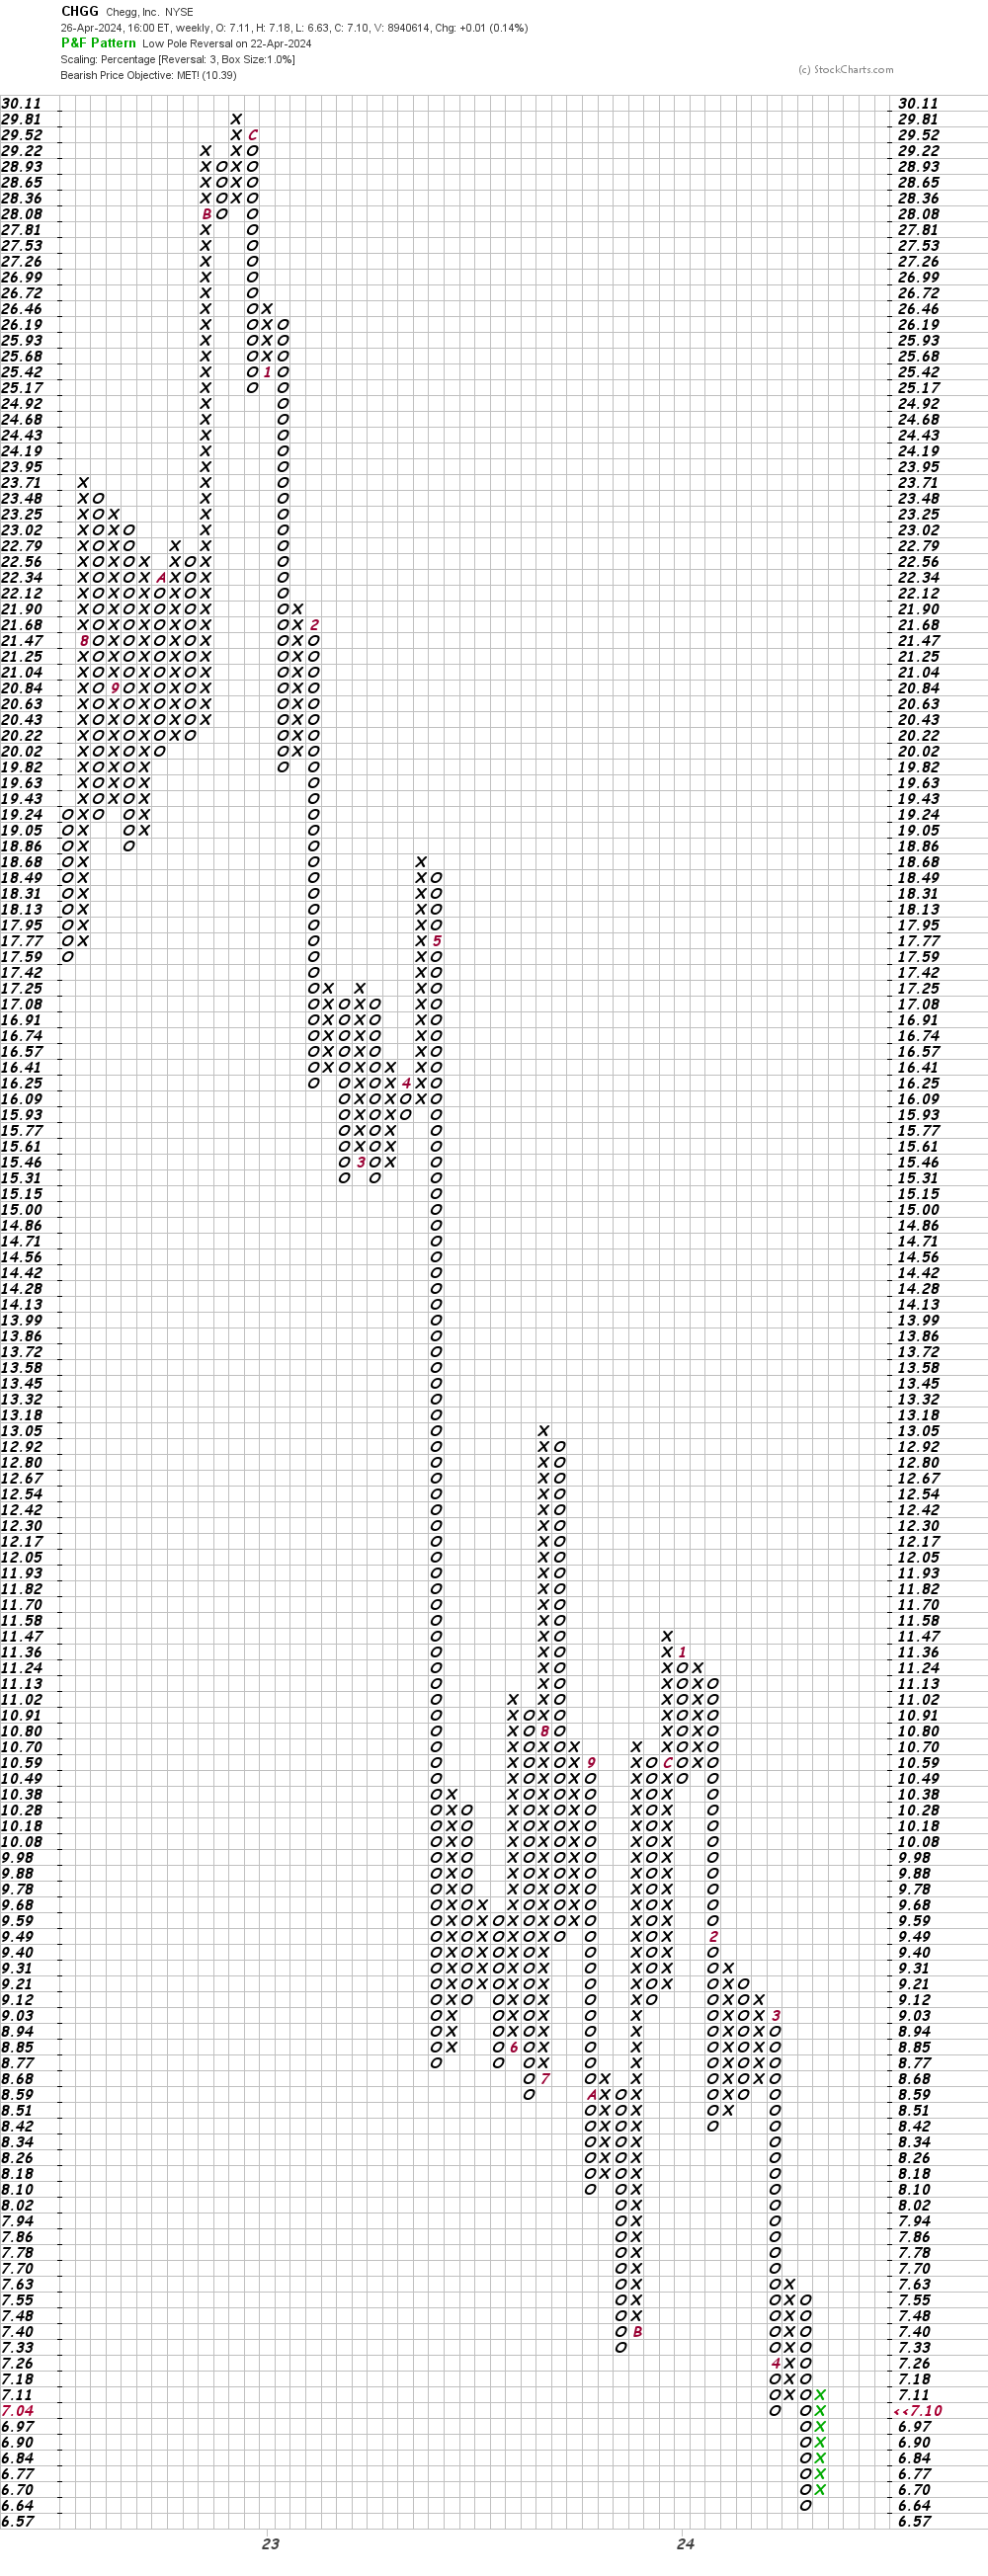
In this weekly Point and Figure chart of CHGG, below, I can see that the shares reached and exceeded a downside price target in the $10.39 area.
Bottom-line strategy: I have no special knowledge of what CHGG will tell shareholders Monday evening. The charts have been bearish for a while now and have not built a base pattern. However, I would not rule out a potential bounce to the upside as the pace of the decline has slowed.
Employees of TheStreet are prohibited from trading individual securities.