Stocks Look Euphoric Again—and History Says a Pullback May Be Next
Bullish sentiment is surging across key indicators, and similar setups recently led to fast S&P drops. This market may be due for a shakeout.
You've reached your free article limit
You've read 0 of 1 free Pro articles.

The Market
The number one question in my inbox late last week: Did we get to giddy?
The answer is not black and white. Some sentiment indicators are beyond giddy, while others remain merely complacent. Let’s start with the giddy ones.
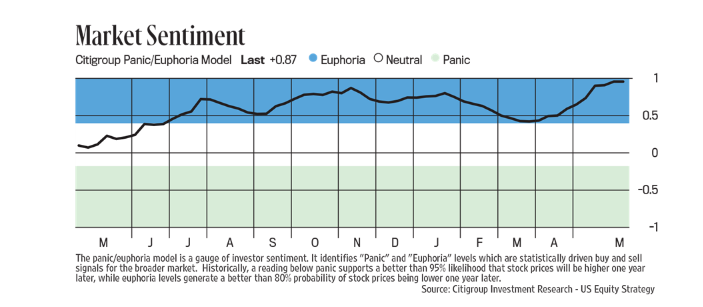
A week or so ago, I was able to cite the options ratios as giddy as well as Market Vane Bulls. I could also add in the Citi Panic/Euphoria Model; however, I did go back to late 2021 to see where this indicator was, and it was well beyond where it is now. Now it is at +.87. Back in the frenzy that was 2021, it was over +2.0!
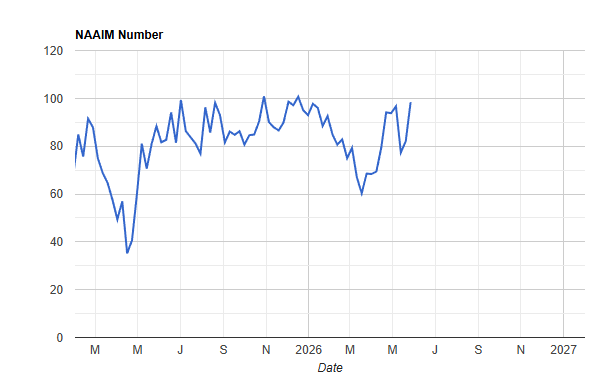
Now I can put the NAAIM Exposure on the giddy list as they have lifted their exposure up to just over 98, which is the neighborhood we saw last fall (when the S&P and Nasdaq peaked and went into that extended churn sideways). Over 100, and these folks are on margin.
I can also add that while the DSI for Nasdaq (81) and the S&P (81) have not yet pushed to giddy, the DSI for the VIX is at 14, which is now into the giddy zone.
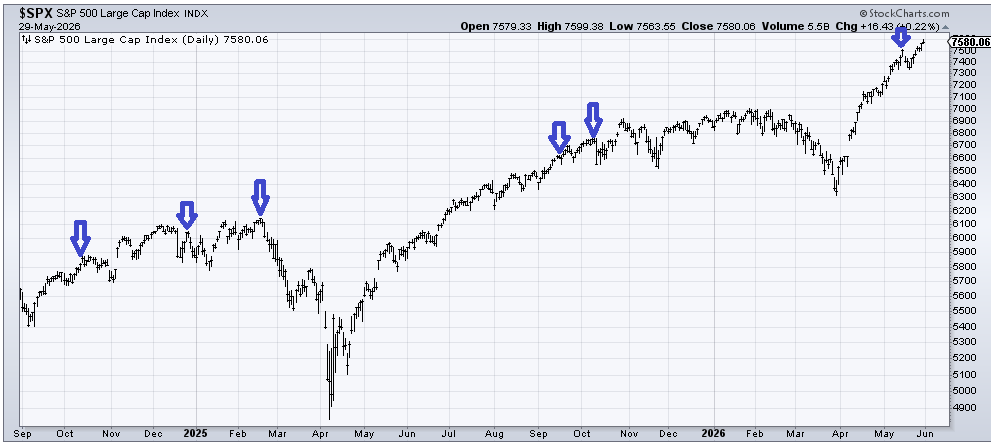
Friday, we did not see the ISEE call/put ratio for equities get over 3.0 (giddy), but we did see the reading for the total (as opposed to just equities) get to giddy when it tagged just shy of 2.0. I looked back and realized that while I was waiting for that reading over 3.0, it turned out in the last two years, we have seen readings for the total in that 2.0 area six times.
Three of those times, the reaction was an immediate drop in the S&P of approximately 100 points—within three trading days, we saw a decline of 92 points, 200 points, and 130 points. I realize in this market the percentages are small, but we all know they never feel small at the time.
I’ve marked the six times on the chart of the S&P below. What strikes me is that not one of these readings came at/close/near a low, and all of them saw a market reaction not long thereafter. At the very least, enough to give traders pause and shake ‘em out.
Friday’s put/call ratio (total) was .64 which turns out to be the lowest since those heady days of early 2021. And you have to admit when stocks like Blackberry (does anyone even use a Blackberry anymore?!) have tripled, you know there is speculation run amok.
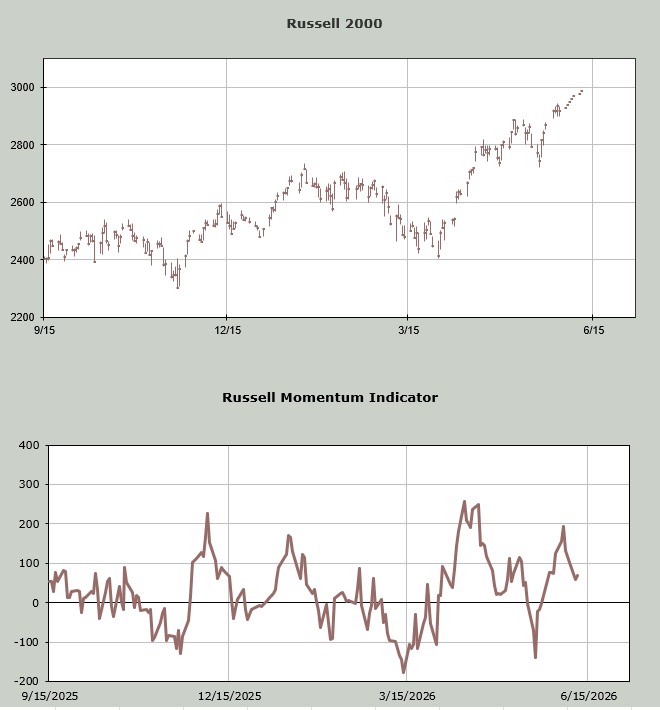
Finally, just about two weeks ago, I showed you the Russell 2000 Momentum Indicator. Keep in mind, this was when the index was down five percent from its high, and I plugged in lower closes showing it was oversold. I thought it was still oversold a week ago. But that is no longer the case.
On this chart, I have plugged in higher closes (up about one hundred points) for the next week or so, and you can see the Momentum Indicator goes down. That makes it overbought in the short term. Remember, this is not meant to peg the exact day (although the day is Tuesday, June 2nd), it is meant to find the general time frame, so let’s call it this week.
This market needs a shakeout.
New Ideas
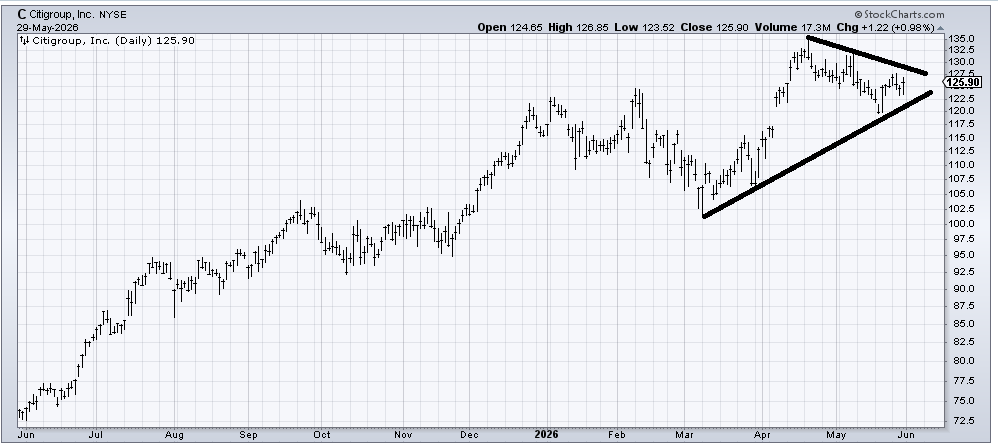
After weeks (months?!) of picking on the banks, it occurs to me that we came into the year with everyone thrilled about the banks (but not tech, definitely not tech!), and the banks have mostly been terrible, so no one recommends them anymore. Maybe Citigroup (C) has corrected enough, and as long as it doesn’t break that 120 area, it can cross over that downtrend line.
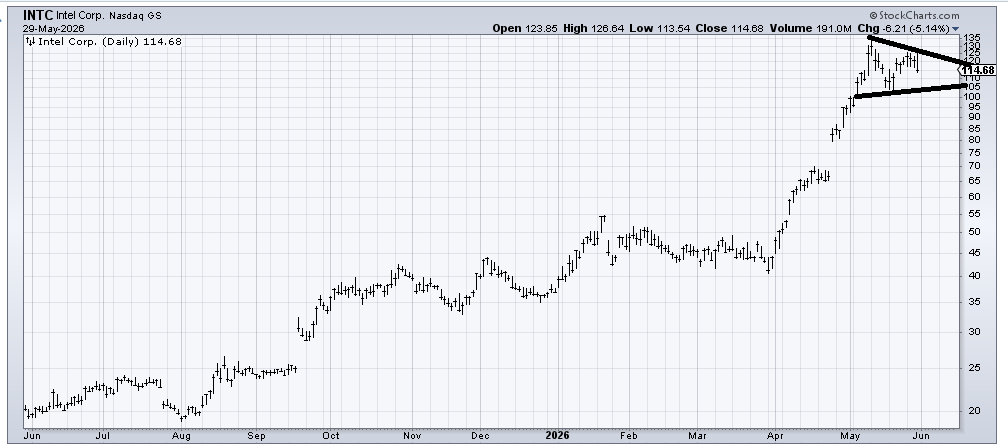
I have cited Intel for the last month as a semi stock that I thought had gone parabolic, so I want to highlight that it has made a lower high and that Friday was an outside day (higher than the prior day and lower than the prior day). The stock looks vulnerable to me. I can see it testing that 105 area.
Today’s Indicator
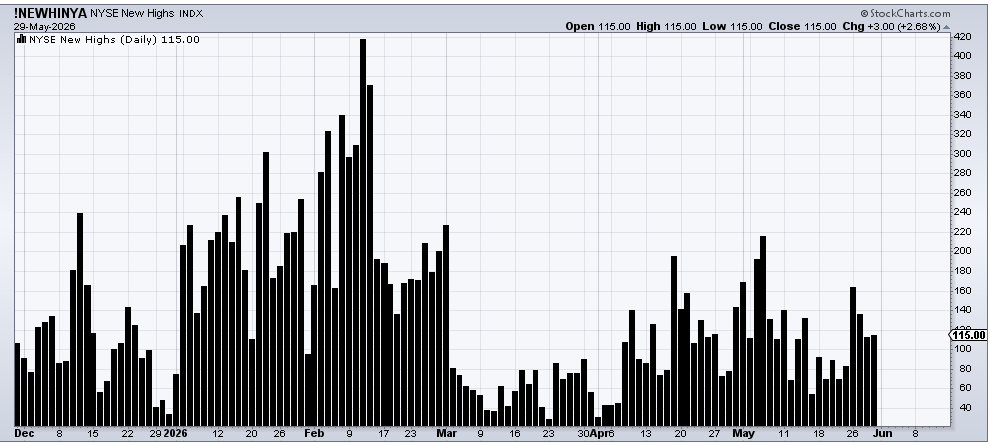
The new highs have been and continue to contract, not expand.
Q&A/Reader’s Feedback
Helene welcomes your questions about Top Stocks and her charting strategy and techniques. Please send an email directly to Helene with your questions. However, please remember that TheStreet.com Top Stocks is not intended to provide personalized investment advice. Email Helene here.
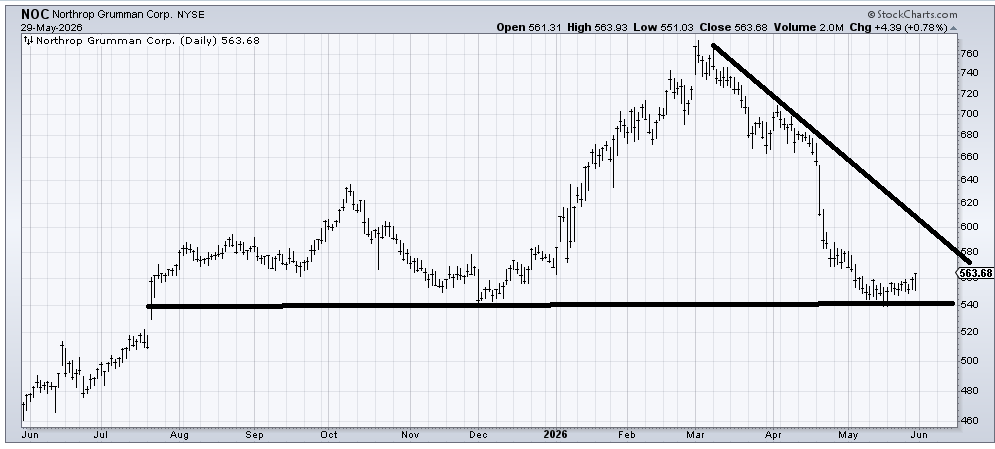
I would put Northrup Grumman (NOC) in the same chart pile as Raytheon (RTX), which I warmed up to about a week or so ago. They have come down far enough and have started to hold and ought to rally.
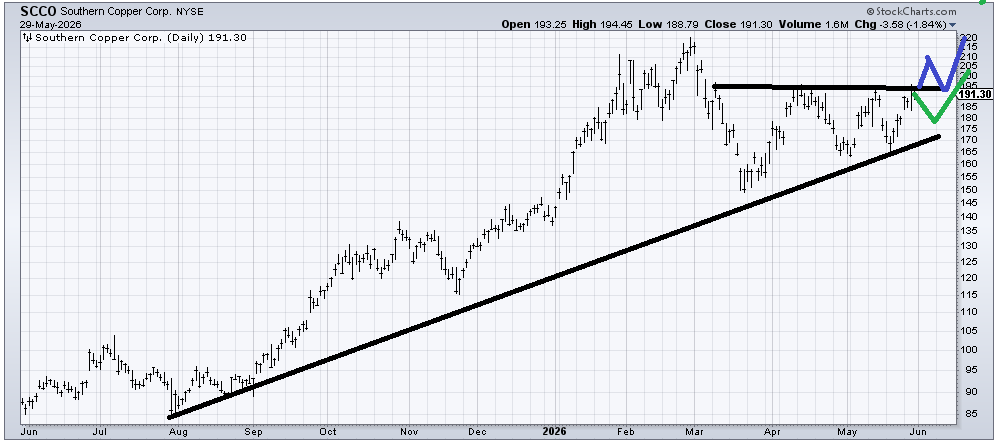
I want to like Southern Copper (SCCO), but I want it to either cross 195 and then come back and retest it (drawn in blue) or I want to see it pull back and then make another run at 195 (drawn in green). Right here at 191, it’s a toss-up with a risk/reward that doesn’t jump off the page at me.
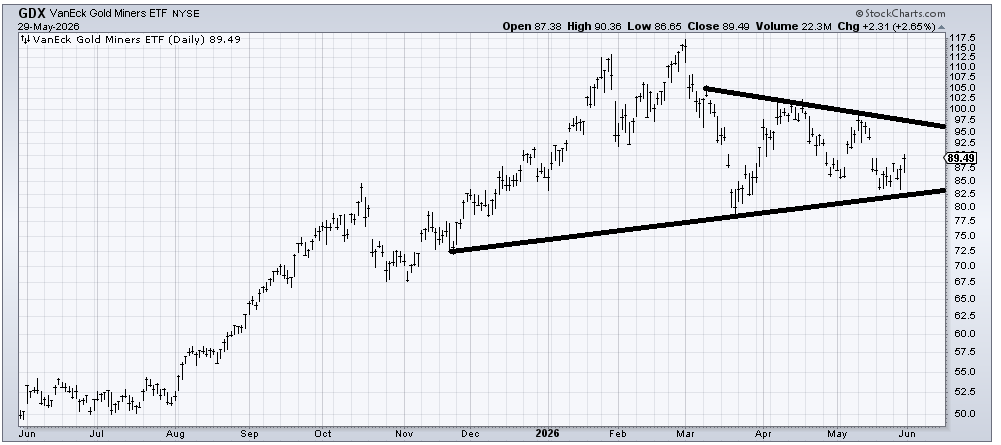
I’ve fielded a lot of questions on gold and GDX lately. For months, I have been saying I thought GLD was in a mostly sideways pattern and could/ought to develop the way it did last year, with a prolonged sideways that then led to another rally. I still feel that way, and I feel that way about GDX. Right now, it is trapped in a triangle (triangles are patterns of indecision). If you have some patience, then nibbling in this area is not a bad idea. I’d find the risk/reward in the 85 area a bit better because under 80, and I am just wrong about the sideways pattern (and this is instead a top). I lean positive on GDX for the first time in months.
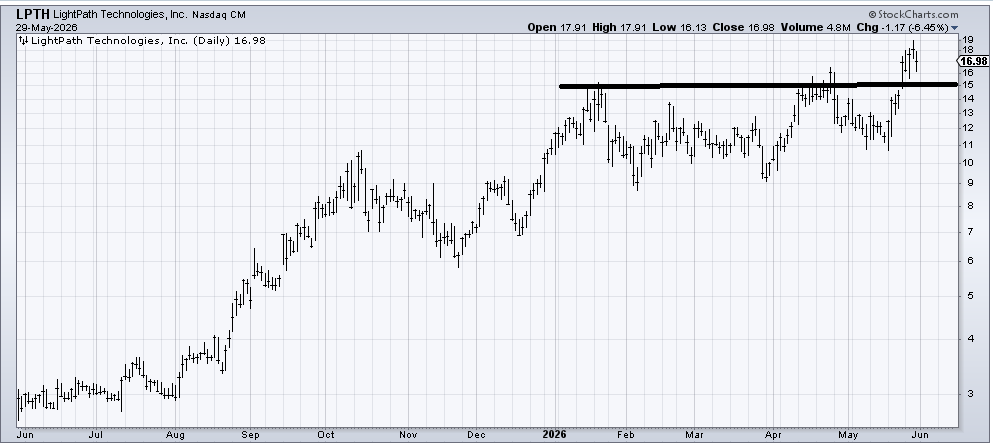
Lightpath (LPTH) hasn’t done anything wrong. In fact, it is just short-term overbought, so as long as it stays over that 15-ish area, it’s ok with a measured target in the low 20s.
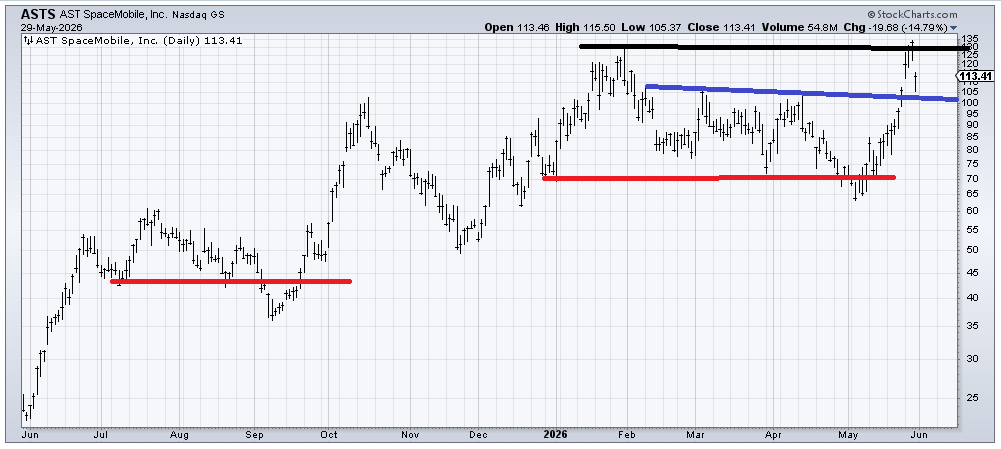
AST Space Mobile (ASTS) is not my kind of chart because it has doubled in a month and got right to resistance. However, as long as it stays over 100 (blue line), the stock is okay. The chart has a tendency to trade very thinly and therefore break levels and snap back (see red lines), and rarely forms a gradual bottom, so perhaps it will never be my kind of chart!
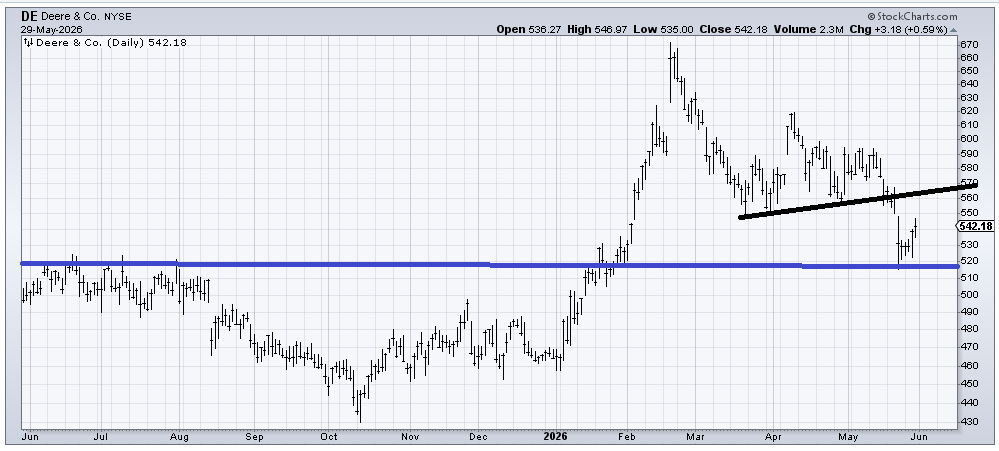
The best thing Deere (DE) has done in the months since February’s high is bounce off support (blue line). So, for the time being, I would say it’s going to run into a lot of resistance if it can get to that 560-570 area. It looks more like an oversold rally than anything else. Should it do some work over the next several weeks (between the low 500s and the high 500s), I might warm up to it again (see that period between August and December where it just churned and based).
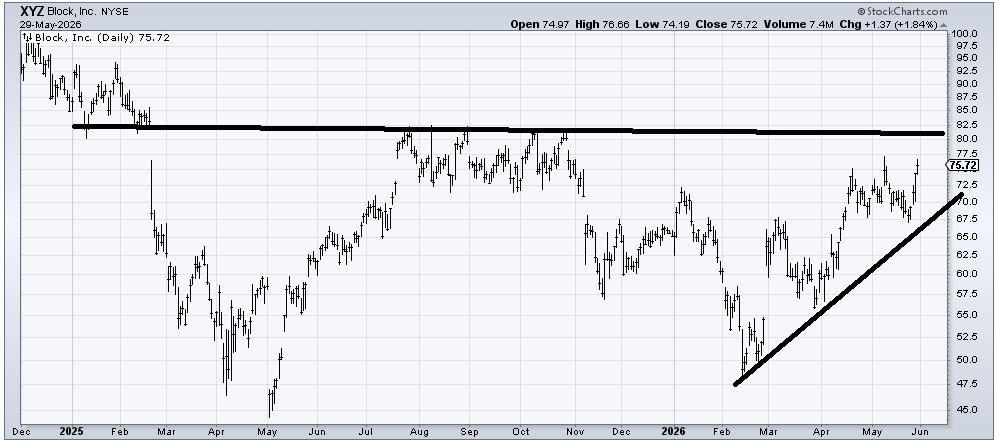
Block (XYZ) is developing into an interesting chart, teasing me with a potential base. It needs some more work before I believe it can/will breakout, but I’d keep my eye on this. You might need patience, but as long as that 67-ish area holds, I lean toward liking it. The big question is if it can get over that 80-82 area that has kept it in check for the last 18 months.