Stock Charts Show Trouble for Crocs Ahead
The shoe company beat estimates in its latest report, but a the stock price has missed a step.
You've reached your free article limit
You've read 0 of 1 free Pro articles.
On Thursday morning, Crocs CROX reported a non-GAAP EPS of $4.01, which beat estimates by $0.44, and revenue of $1.12 billion, which beat by $20 million. Sounds OK, but investors seem focused on the company's Q3 profit warning and the stock price has missed a step in trading as a result.
Let's check the charts and indicators to see what has changed.
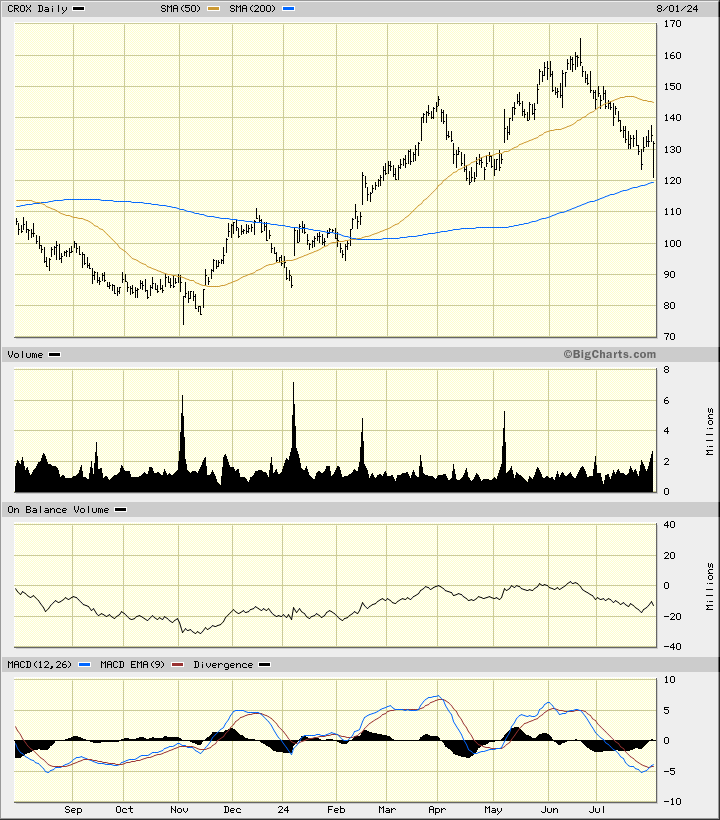
In this daily bar chart of CROX below, I can see that share prices have been moving lower since the middle of June. Prices have dipped down today to test the rising 200-day moving average line. The slope of the shorter 50-day moving average line is negative. The On-Balance-Volume (OBV) line made a bearish divergence in May and June as it moved sideways while prices continued to rally. In July the OBV line weakened. The Moving Average Convergence Divergence (MACD) oscillator is below the zero line in sell territory.
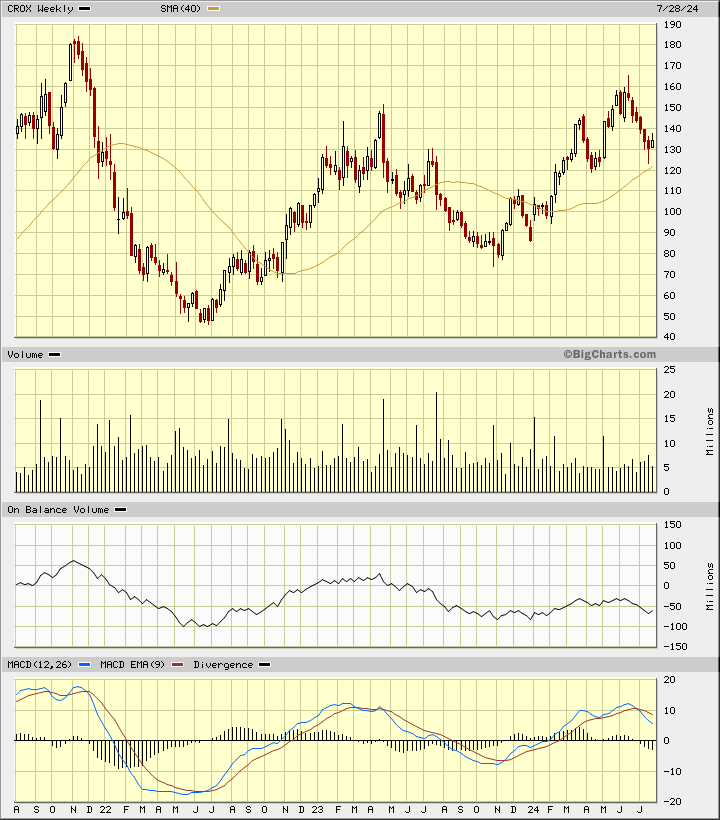
In this weekly Japanese candlestick chart of CROX below, I see a number of bearish clues. Prices rallied from the lows in 2022 and are currently testing the rising 40-week moving average line. Trading volume did not expand on the rally and that is a bearish development. The OBV line made a high in April 2023 and a lower high in 2024 even though prices made a higher high — a bearish divergence. The MACD oscillator has crossed to the downside for a take-profits sell signal.
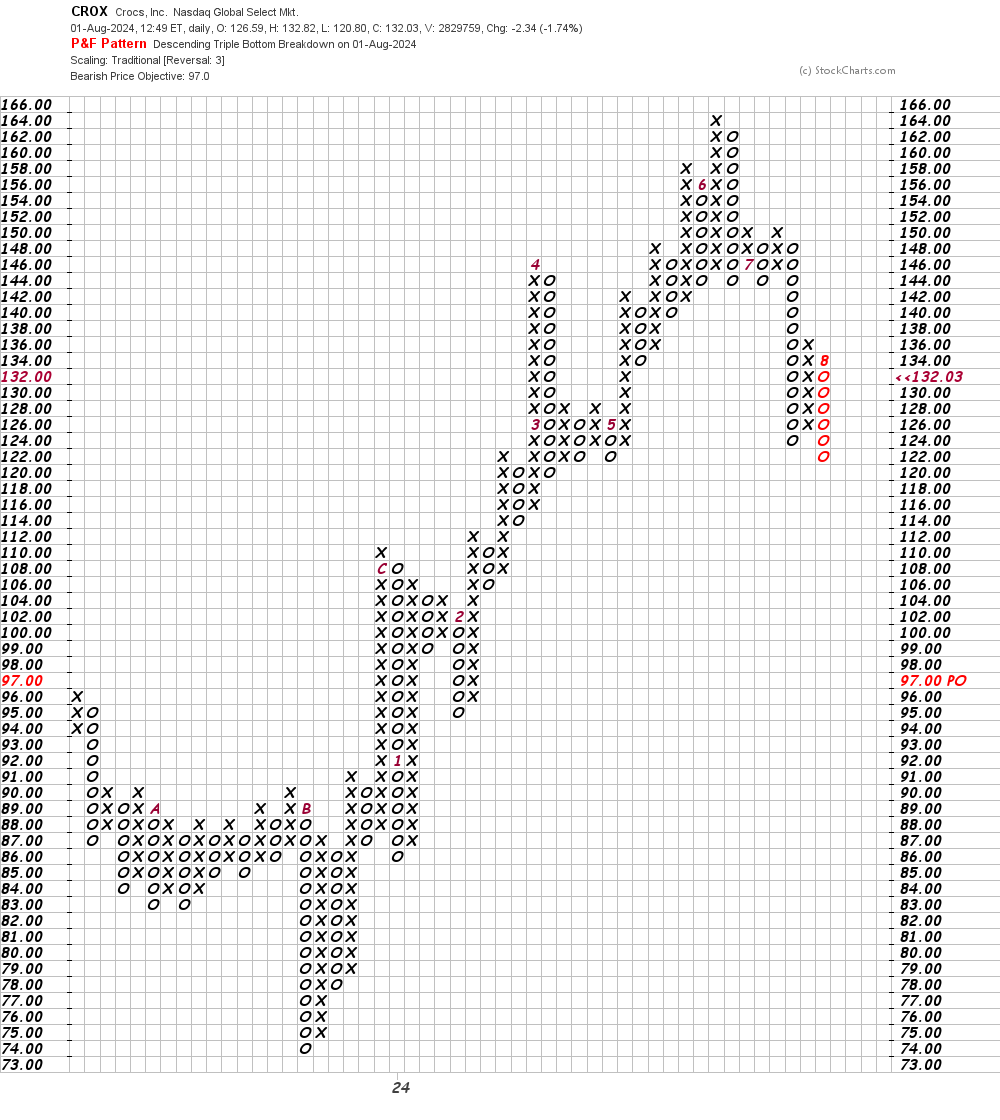
In this daily Point and Figure chart of CROX below, I can see a potential downside price target in the $97 area.
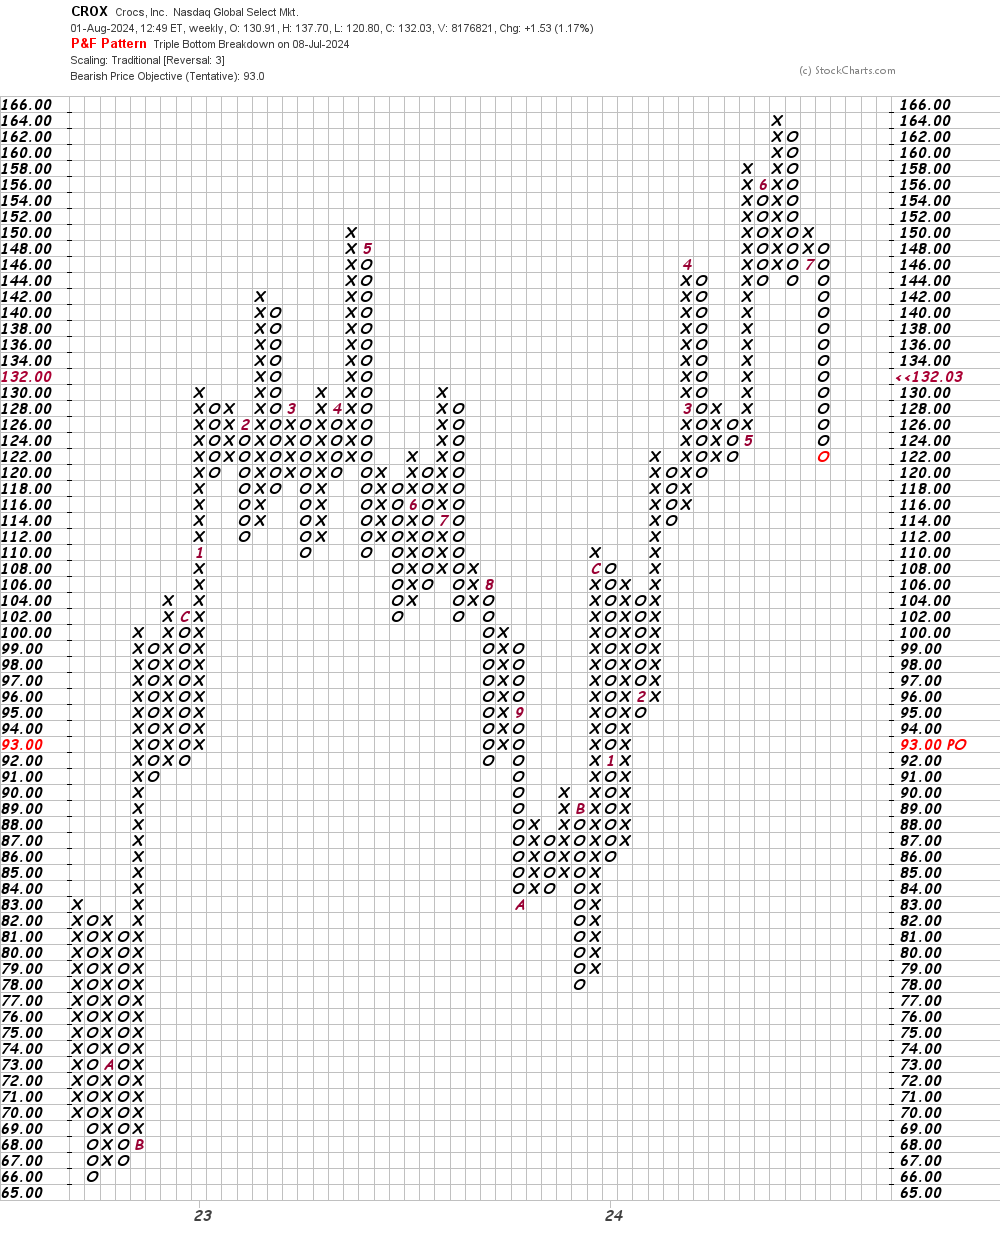
In this weekly Point and Figure chart of CROX below, I can see a possible downside price target in the $93 area.
Bottom line strategy: In full disclosure, I got a hand-me-down pair of Crocs from my neighbor and I love them. I especially like wearing them when I garden. But the product is one thing and the stock price is another.
I don't know if CROX will survive a test of the 200-day line but my sense of the charts and indicators tells me not to depend on a moving average line for a successful investment.
Employees of TheStreet are prohibited from trading individual securities.