Step Into Las Vegas Sands and You Might Quickly Sink
The charts suggest this stock won't put traders on solid ground.
You've reached your free article limit
You've read 0 of 1 free Pro articles.
UBS downgraded the shares of Las Vegas Sands LVS to a hold equivalent rating on a slower profit recovery in Macau. Let's check out the charts of LVS to see if they are going to hit or stay.
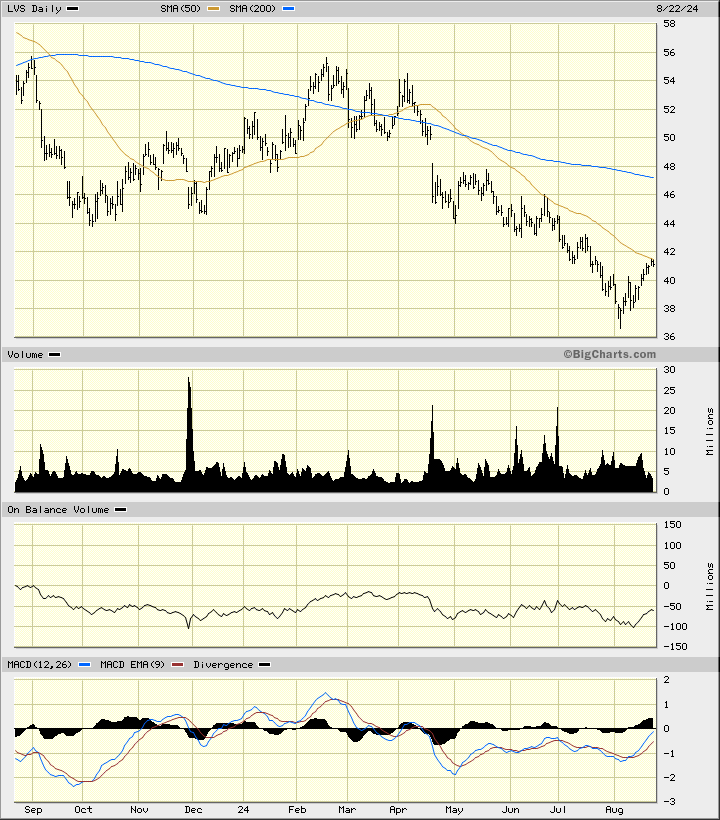
In this daily bar chart of LVS, below, I can see a decline into early August followed by a bounce. LVS rebounded to the underside of the declining 50-day moving average line.
The slope of the 200-day moving average line is negative and it intersects up around $47. The On-Balance-Volume (OBV) line has been weak from April to August. The trend-following Moving Average Convergence Divergence (MACD) oscillator shows improvement since early May, but still remains below the zero-line.
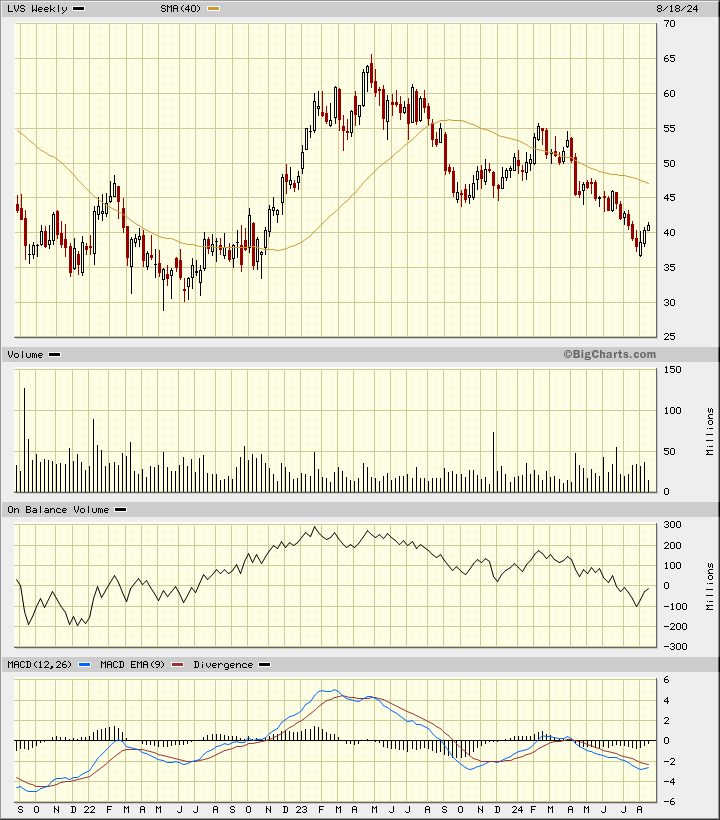
In this weekly Japanese candlestick chart of LVS, below, I can see that prices are in a longer-term decline and trade below the negatively sloped 40-week moving average line. The weekly OBV line shows a decline going back two years. The MACD oscillator is in a bearish alignment below the zero-line.
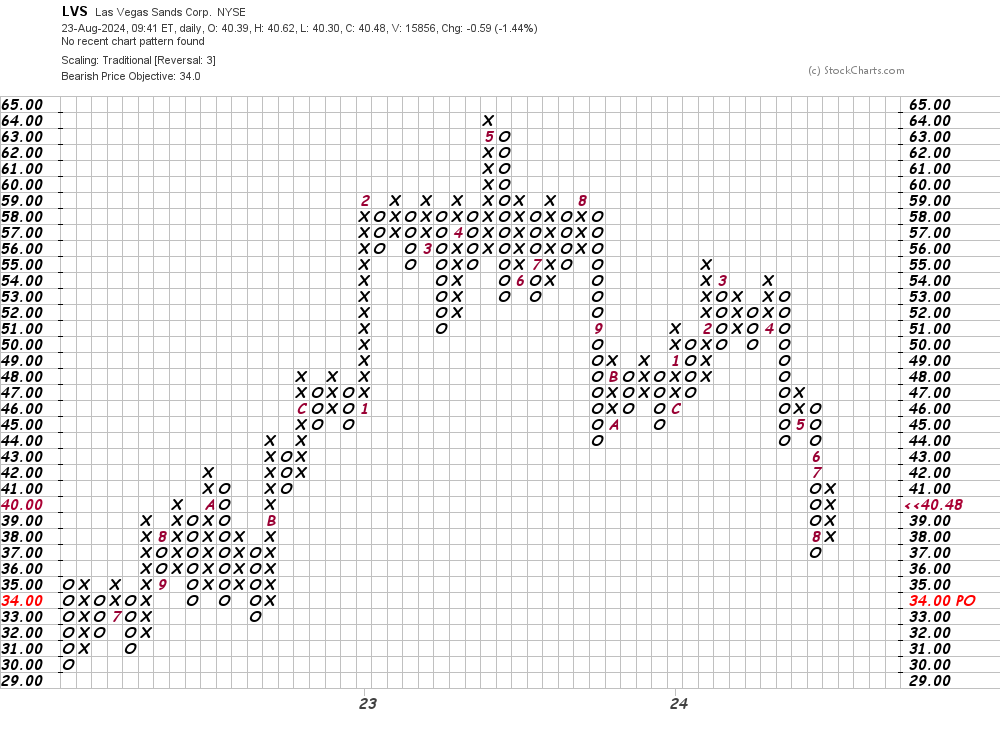
In this daily Point and Figure chart of LVS, below, I can see that the software is projecting a potential downside price target in the $34 area.
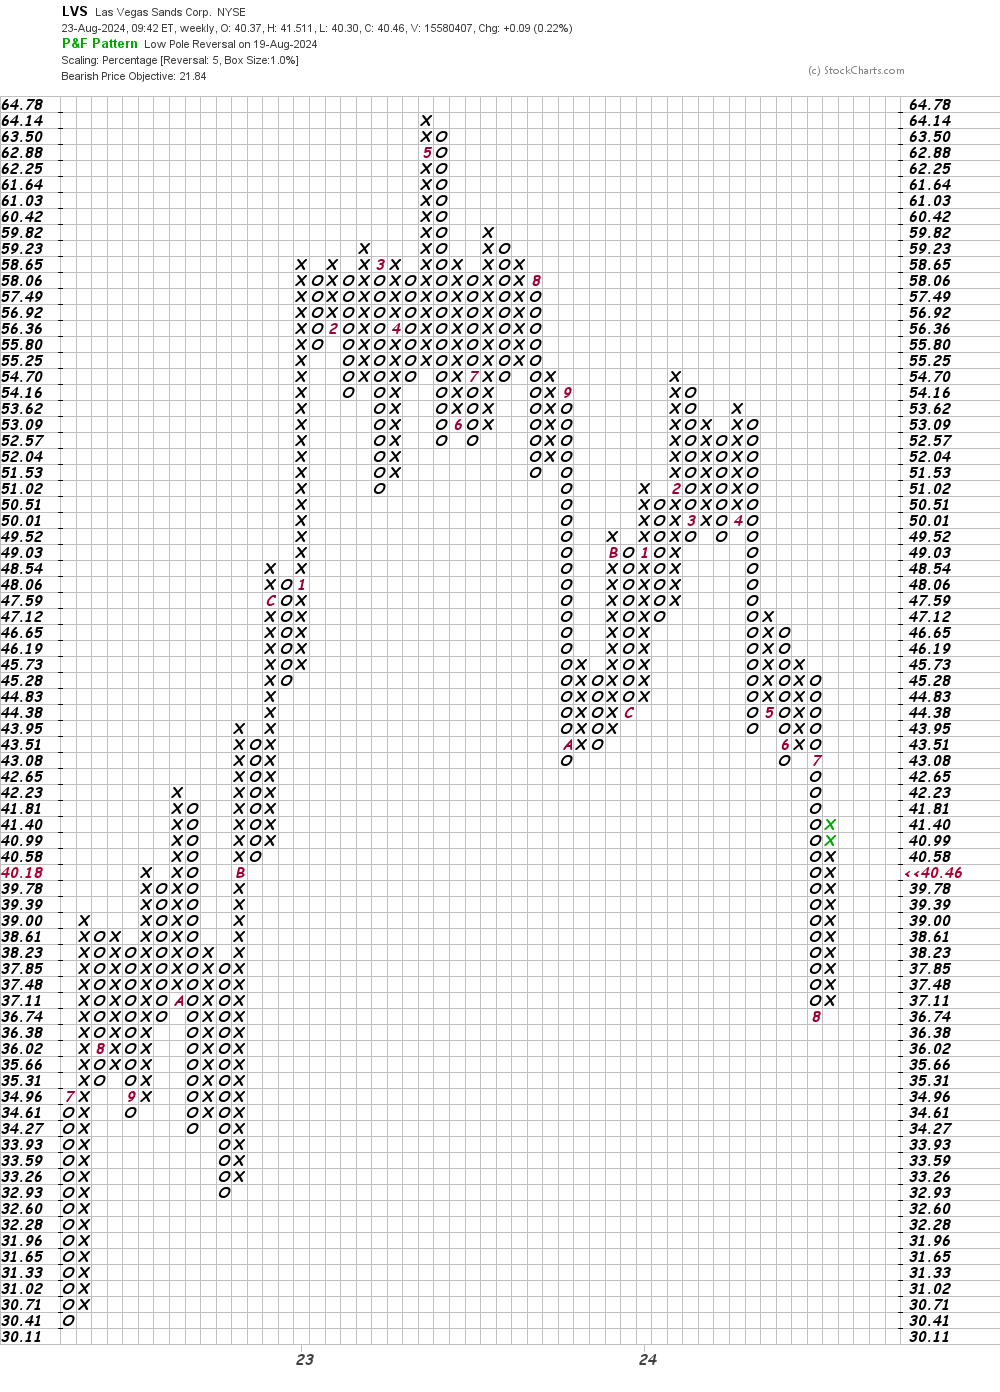
In this weekly Point and Figure chart of LVS, below, I used a five box reversal filter. Here the software is suggesting a price target in the $22 area.
Bottom line strategy: There is a risk that LVS heads still lower on the charts, so traders should defer purchases.
Employees of TheStreet are prohibited from trading individual securities.