Stellantis Slips Into Reverse After Reporting
Let's kick the tires on the parent of Chrysler, Dodge and Jeep to see where the stock is headed.
You've reached your free article limit
You've read 0 of 1 free Pro articles.
Stellantis N.V. STLA designs, manufactures, and sells automobiles bearing its 14 brands. Here in the U.S. I am more familiar with Chrysler, Dodge and Jeep but there are much more. On Thursday the company reported non-GAAP EPS of €2.36 and revenue of €85.02B. They also reaffirmed their 2024 outlook.
Let's kick the tires and the charts.
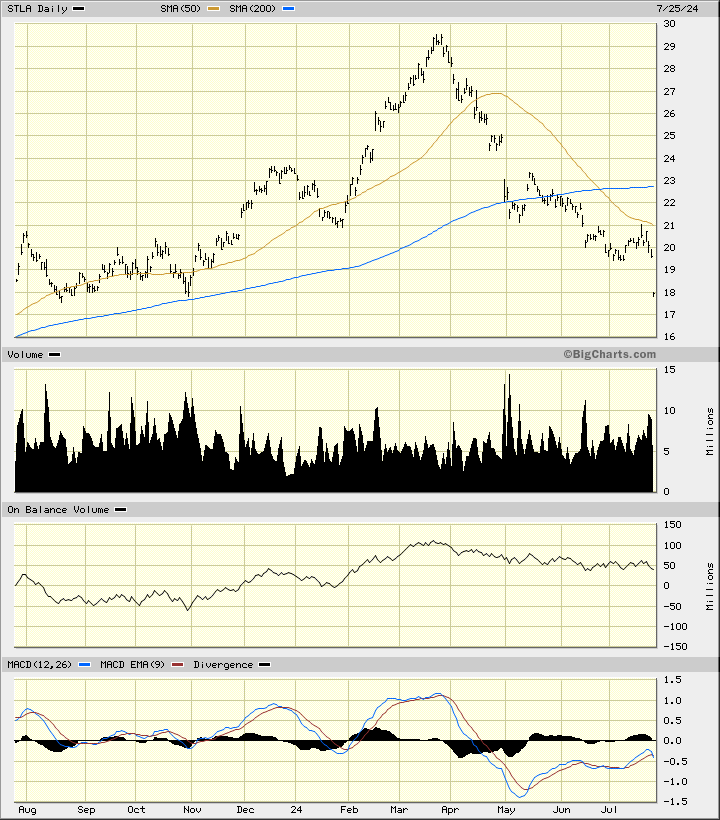
In the daily bar chart of STLA, below, I can see that the share price has been in reverse since making a high in March. Prices have retraced the entire rally of the last year and trade below the declining 50-day moving average line and the cresting 200-day line.
The On-Balance-Volume (OBV) line has been weak since March and the Moving Average Convergence Divergence (MACD) oscillator is bearish.
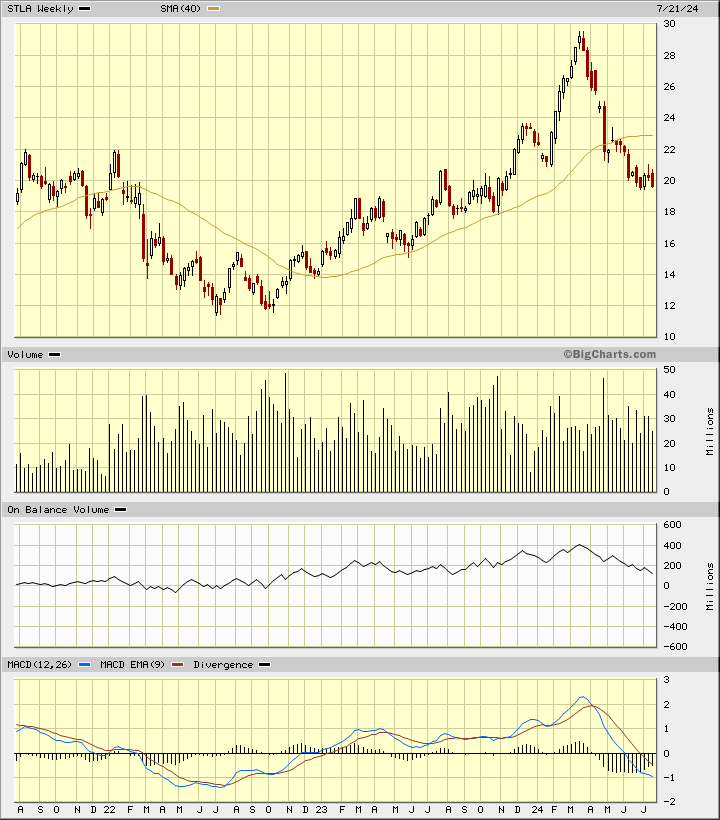
In the weekly Japanese candlestick chart of STLA, below, I can see that the shares have broken a major uptrend. STLA trades below the cresting 40-week moving average line.
The weekly OBV line is pointed lower after breaking a two-year rise. The MACD oscillator is in a bearish alignment below the zero line.
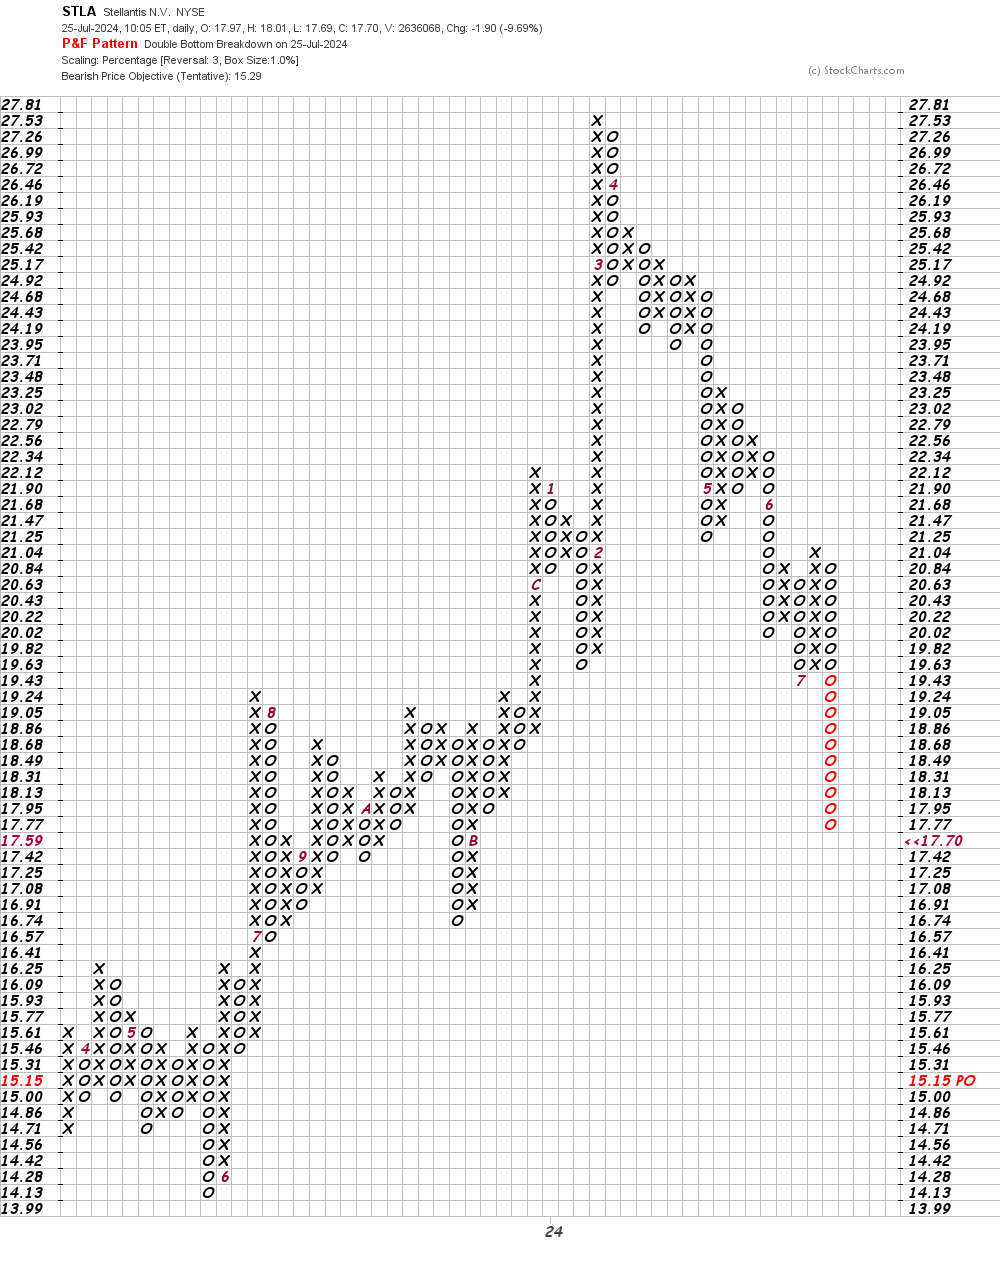
In this daily Point and Figure chart of STLA, below, I can see the recent selloff with no price gap. Here the software is projecting a potential downside price target in the $15 area.
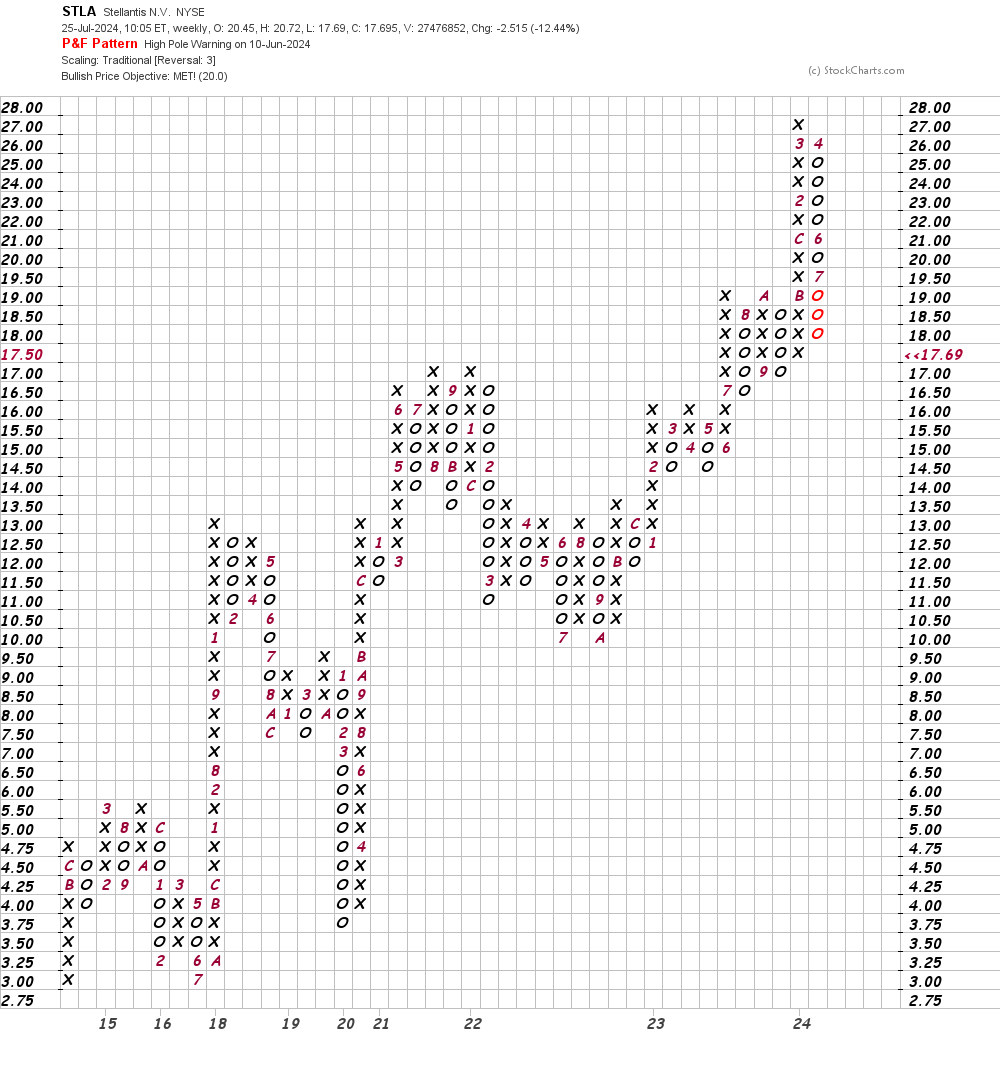
In this weekly Point and Figure chart of STLA, below, I can see that the stock reached a price target but also that a trade at $16.50 or lower would probably generate a bearish price objective.
Bottom-line strategy: Looking at the charts of STLA, GM, F, TSLA and TM Thursday morning I get the impression that the auto industry is weakening around the world.
Traders should avoid the long side of STLA as further declines are likely.
Employees of TheStreet are prohibited from trading individual securities.