Speculation Gone Amok
Speculators have arrived in droves this week. Meme stocks alone were ridiculous but to then trade this many shares of penny stocks is not bullishness and needs to be shaken out.
You've reached your free article limit
You've read 0 of 1 free Pro articles.
The Market
Again I think this was the overboughtness of the market that we saw Thursday. But I want to discuss this week in general. Because something changed in the market this week. What changed was the speculators arrived in droves.
What changed is best seen in market volume. The first two days of the week were all about a handful of meme stocks that surged and skewed volume to the upside. Then Wednesday saw volume skew to the downside while the index movers took hold and pushed the indexes to their best day of the week.
Then came Thursday. Sure, the meme stocks were lower and thus one might say it skewed the volume to the downside but that was in fact not the case. The speculation has moved from the meme stocks early in the week to penny stocks late in the week.
Today the Nasdaq traded over 12 billion shares of stock. TWELVE BILLION. According to my data that is the highest volume on record for the Nasdaq. Oh and 84% of it was on the upside. If you are wondering how that can be, look no further than the penny stocks.
There were three stocks on the Nasdaq, two that were under a buck and one that was just over a buck, that accounted for nearly six billion, which by my math is half of the volume on the Nasdaq.
You can call it what you want but I call it speculation gone amok. Meme stocks alone were ridiculous but to then trade that many shares of a penny stock is not bullishness, it is beyond bullishness. And therefore not bullish.
And it is especially not bullish when the market is still short-term overbought.
I could give you a host of other indicators to chew on but I think this nonsense is not healthy and needs to be shaken out of the market.
New Ideas
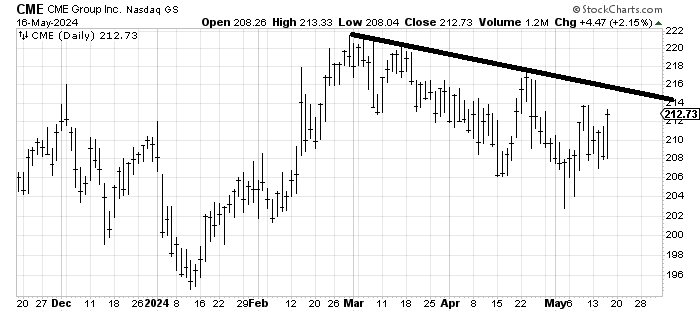
CME Group CME has gone nowhere since I warmed up to it a month or so ago. But the pattern keeps developing to my eyes. I would really like to see it get up and over that downtrend line sooner rather than later.
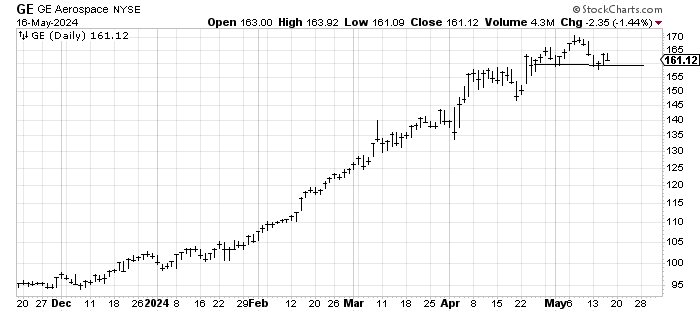
Way back in January I recommended General Electric GE and I believe around $155 I thought it had gone far enough. In the last month the pattern of the chart has changed. Prior to this it has literally been straight up without a breather but now it has a small head-and-shoulders top that has developed. If the stock breaks it measures to that $150 area, which would also be a gap fill.
Today’s Indicator
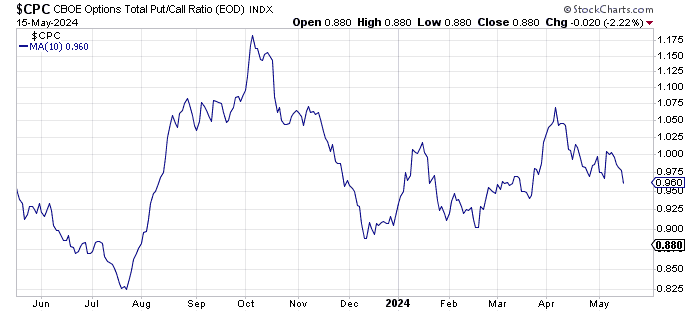
There has been another change this week. The options market has been so steady that it isn’t even worth discussing. Yet this week folks discovered calls instead of puts. Sure, I know it is an options expiration week but the put/call ratio clocked in three readings under 0.90 this week, something it hasn’t done in a long time. And it was enough to pull the 10-day moving average down to 0.95 as it closes in on the March low reading.
Q&A/Reader’s Feedback
Helene welcomes your questions about Top Stocks and her charting strategy and techniques. Please send an email directly to Helene with your questions. However, please remember that TheStreet.com Top Stocks is not intended to provide personalized investment advice. Email Helene here.
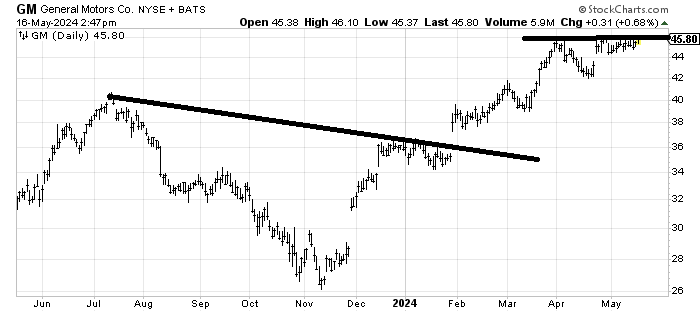
General Motors GM hasn’t done anything wrong but it hasn’t exactly been stellar in this rally; it lacks life. There is an unfulfilled target around $48-ish so if you want to buy it for that move, the risk/reward doesn’t seem great because the stop is under $44. Maybe you can just watch to see if the stock wants to power through and jump on board for a trade.
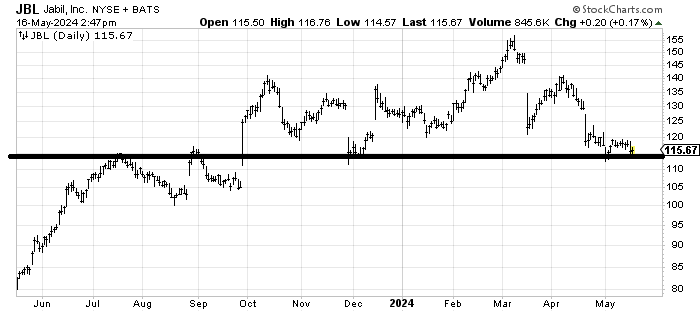
What bothers me about Jabil JBL is that if it breaks from here that’s a big top. And the resistance starts at $120. If you want to bottom fish the stock use a stop under $114. The selling might be done but so far there is little buying interest.
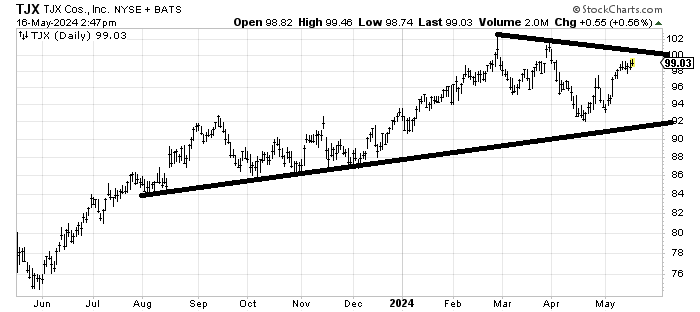
TJX Cos. TJX has some resistance overhead in that $102 area but the chart just seems more like it is in the middle of nowhere. I would not want to see it turn south under $98.
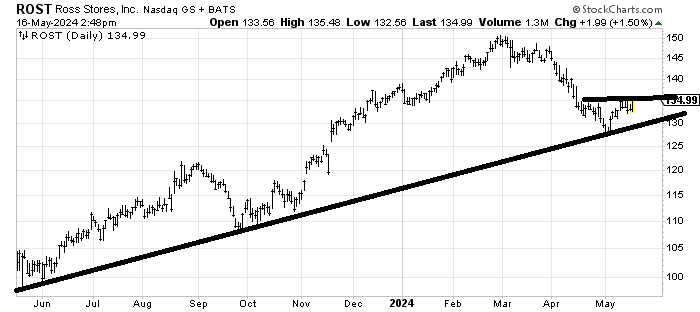
If you are looking to bottom fish in the discount retail area then Ross Stores ROST looks more interesting to me. It has a potential small head-and-shoulders bottom and it bounced off a long term uptrend line.
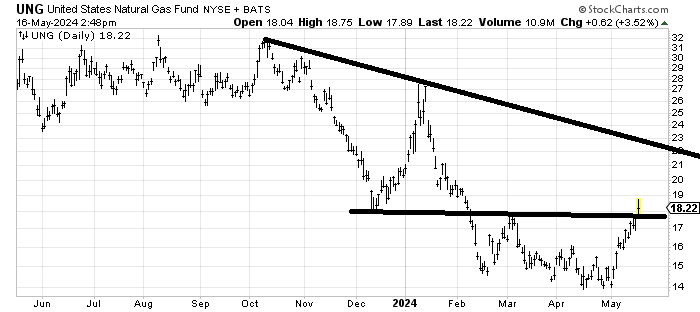
United States Natural Gas Fund UNG, an ETF for natural gas, broke out Thursday. It didn’t hold the gains that much but it is up in a straight line from $14. I’d like to see it do a bit of work in this $17-18 area before making another push up toward $22.
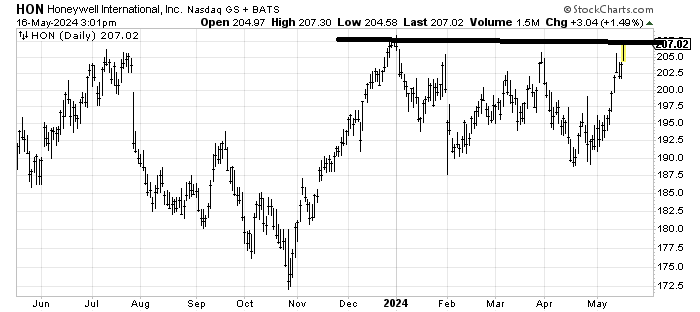
I do not have a target for Honeywell HON yet. I do think it has some resistance here so if you bought it well a week or so ago when I recommended it I’d probably take a few profits here and then wait to see if it can break out.