Should You Shop at TJX Ahead of Earnings?
The operator of T.J. Maxx, Marshalls, HomeGoods and more could see higher share prices following earnings this week.
You've reached your free article limit
You've read 0 of 1 free Pro articles.
TJX Companies (TJX) reported its latest quarterly earnings figures on Wednesday ahead of the opening.
Let's check out the charts and indicators for an update.
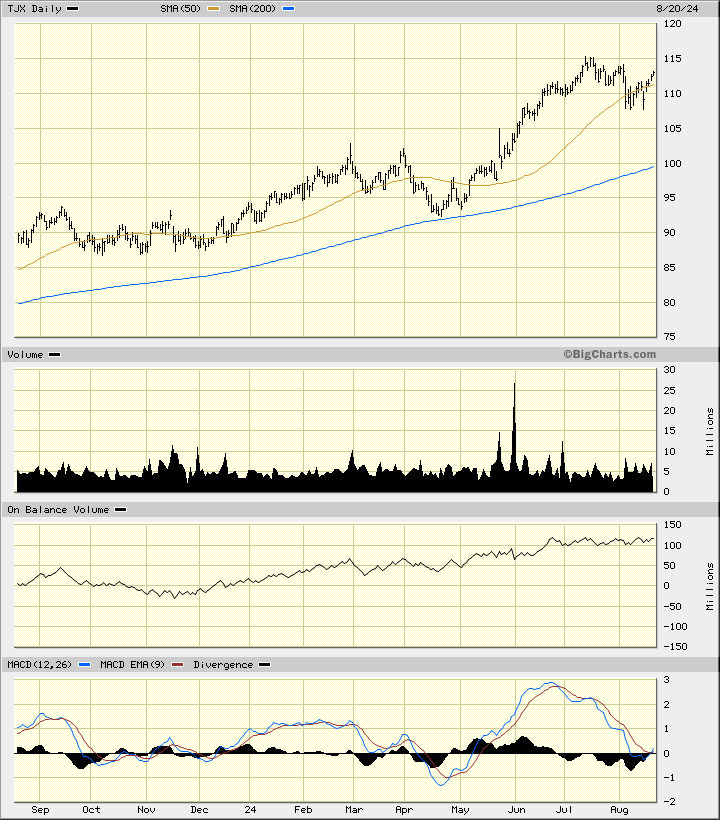
In this daily bar chart of TJX below, I can see that prices have managed to generally move higher the past 12 months. Corrections have not been deep but they have lasted about two months each. Prices are trading above the rising 50-day moving average line and above the rising 200-day line. The trading volume has been steady and active the past year. The On-Balance-Volume (OBV) line has moved in an upward path and tells me that buyers of TJX have been more aggressive than sellers. The Moving Average Convergence Divergence (MACD) oscillator has corrected down to the zero line but now looks poised to turn higher.
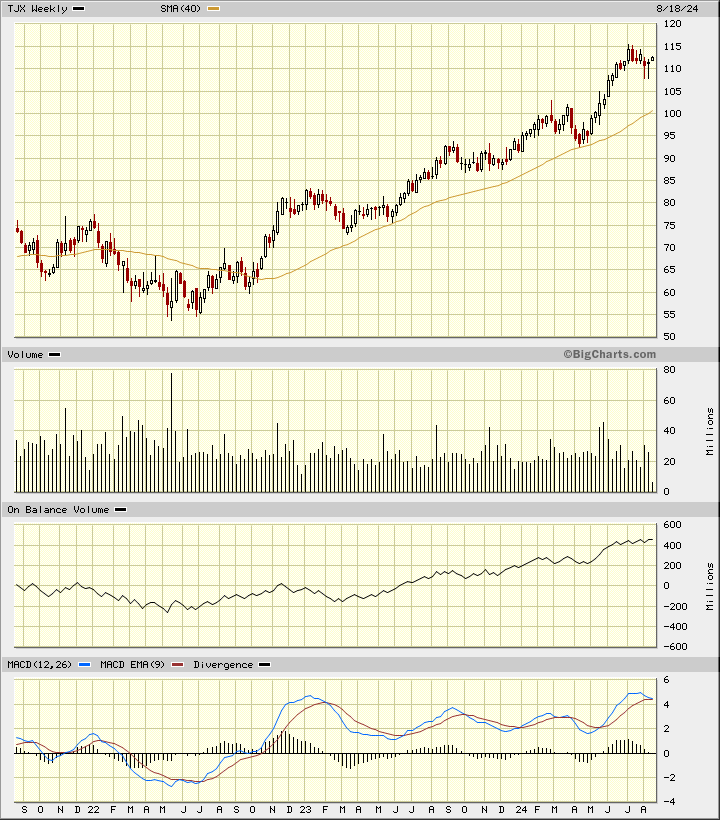
In this weekly Japanese candlestick chart of TJX below, I can see that prices have doubled in the past two-plus years. TJX trades above the rising 40-week moving average line. The weekly OBV line shows us a bullish pattern over the past two years. The MACD oscillator is above the zero line but has narrowed in recent weeks towards a possible downside crossover.
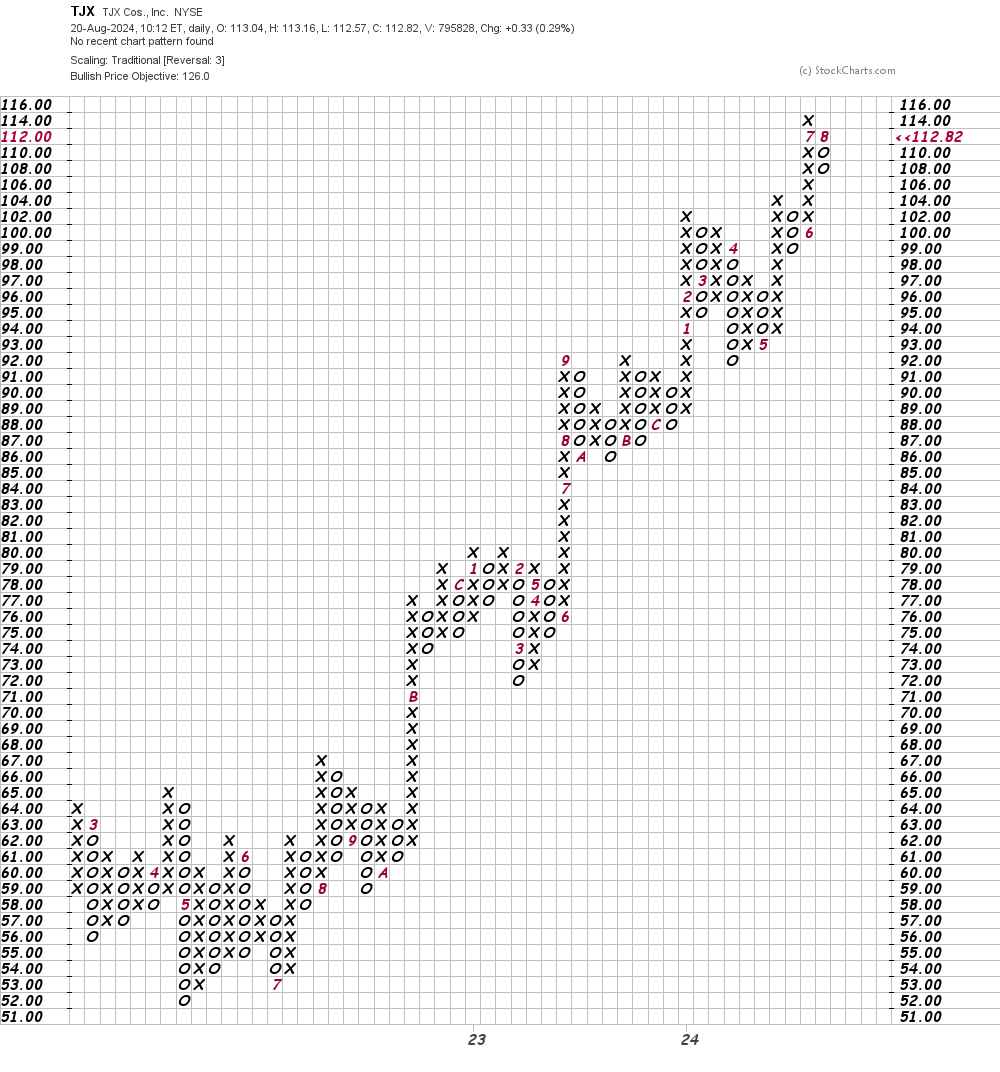
In this daily Point and Figure chart of TJX below, I can see an established uptrend with a price target in the $126 area.
In this weekly Point and Figure chart of TJX below, the software is showing a potential price target in the $156 area.
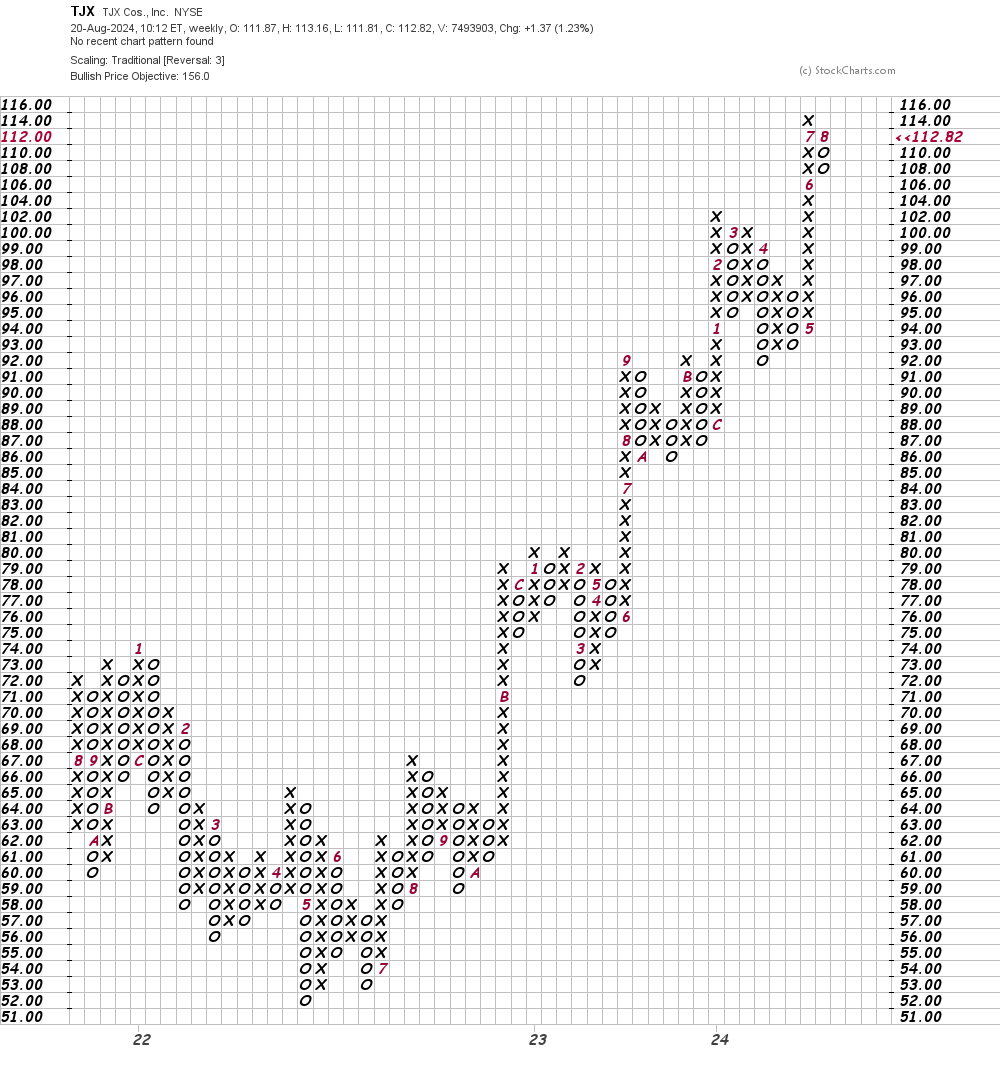
Bottom line strategy: I have no special knowledge of what TJX is going to tell shareholders and analysts on Wednesday morning. A strong beat on the numbers should propel share prices higher. Traders could go long TJX on strength above $116. The $126 area and then the $156 area are my price targets. Risk to $107.
Employees of TheStreet are prohibited from trading individual securities.