Seven Weeks of Trading and We’ve Gone Nowhere
There’s been a lot of movement among individual names since May 6th, but the major indexes have nothing to show for it.
You've reached your free article limit
You've read 0 of 1 free Pro articles.

The Market
The S&P closed at 7365 today. It also closed at 7365 on May 6th. That is nearly seven weeks of volatility with the index going nowhere. Please recall the market reached an intermediate-term overbought condition in mid-May. So far, it hasn’t resulted in much in the way of a decline for the indexes (individual stocks are another story). For the indexes, it has given us a serious loss of momentum.
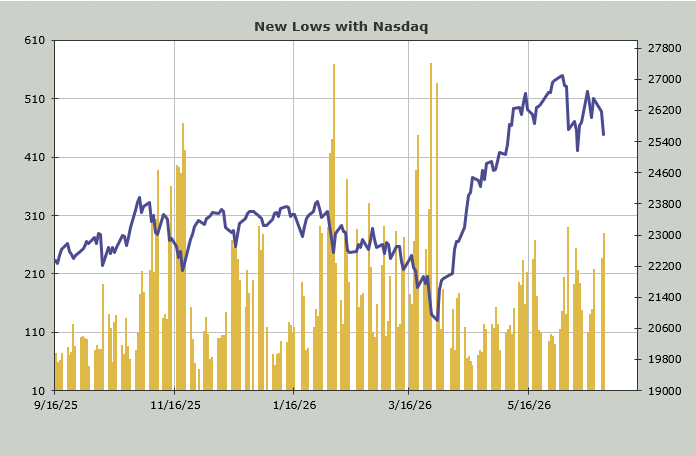
On May 6th, the NYSE had 216 stocks making new highs. Today, that number resides at 56. On May 6th, Nasdaq had 562 new highs. Today, that number is at 150
On May 6th, the NYSE had 32 stocks making new lows. Today, there were 88 new lows. On May 6th, the Nasdaq had 122 new lows. Today, there were 279 stocks making new lows.
So, if you are wondering why it feels as if you are spinning your wheels in the market these last seven weeks, this is the reason. If you haven’t been spinning your wheels, then you have been doing a lot of trading, or you have been long the semis.
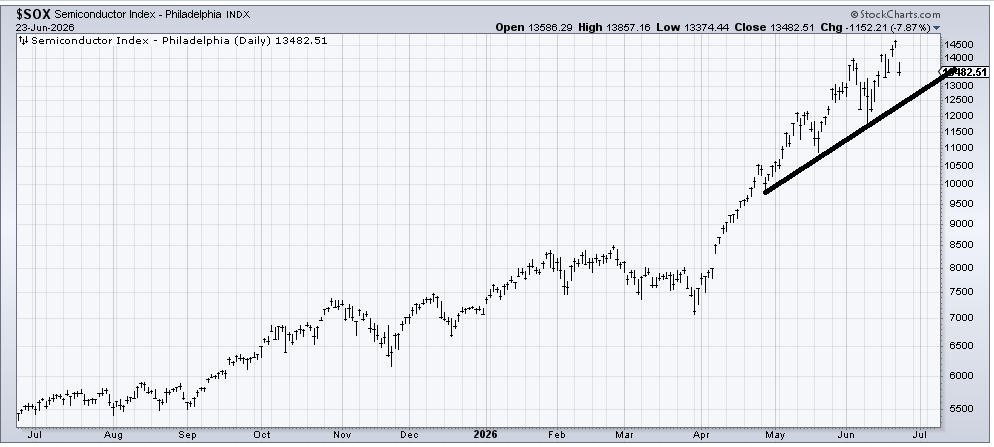
As I have said repeatedly, it’s the semis world, and we’re just living in it. Those statistics prove that out. So let’s talk about the chart of the SOX, which is likely to enjoy a big test in the coming days as Micron reports earnings tomorrow evening.
The chart is not my style since I much prefer down and out stocks. Yet much as I don’t like the SOX, and today’s action doesn’t help the situation, the chart on its own has done nothing wrong. Not yet. It has made higher highs and higher lows. It has not broken the uptrend line that has been in place since late April. It has corrected along the way as well.
This uptrend line comes in at the 12,500 area this week. Next week it’s at 13,000. Both of those are still higher lows (than the early June low). So over the coming weeks, if that uptrend line holds, then nothing has changed. If that uptrend line gives way but the SOX trades down, but not under 11500, it’s a small warning (because of the broken line), but nothing dire.
If it breaks under that early June low, then that will be the first lower low since March, and that’s when we can start saying it has done something wrong. It is grossly overbought; it needs a proper pullback, but that’s the state of the chart right now.
Away from all of that, everyone is getting excited over the broadening out (their term, not mine) since breadth has held up relatively well this week. My guess is it has much to do with the rebalancing of the Russell 2000 and the end of the quarter coming up. So just a reminder that the Russell Momentum Indicator pushes into overbought territory midweek this week.
Let me finish by noting the DSI on oil is still 17, but the XLE was up for the second day in a row (not by much, but green). I continue to think energy should have an oversold rally. Gold’s DSI is back at 13. I’m still a nibbler around here, but if GLD falls to that 360 area, I’d be more aggressive.
New Ideas
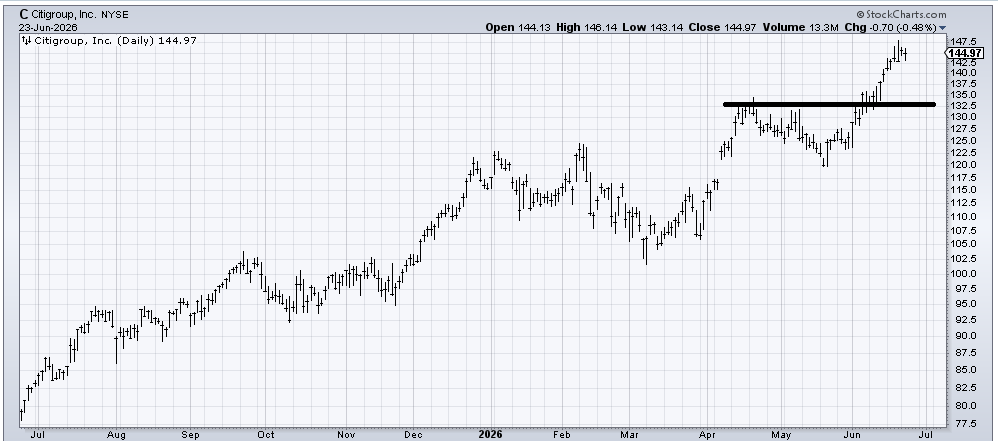
Citigroup (C) has been good to use since I recommended it a few weeks ago, but that breakout measures into that mid-140s area, so I still want to take something off the table here.
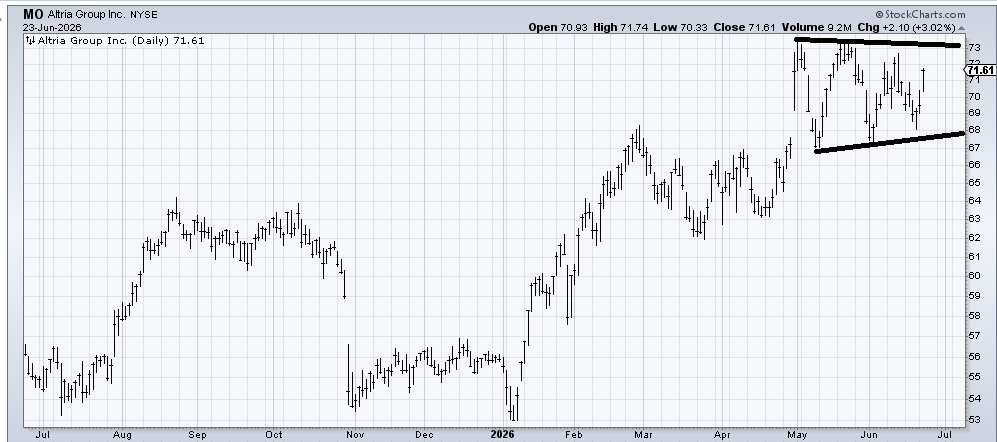
The dividend stocks were hot today, and I was asked about Altria (MO). The stock is okay. If it cannot get up and over 73, I would worry.
Today’s Indicator
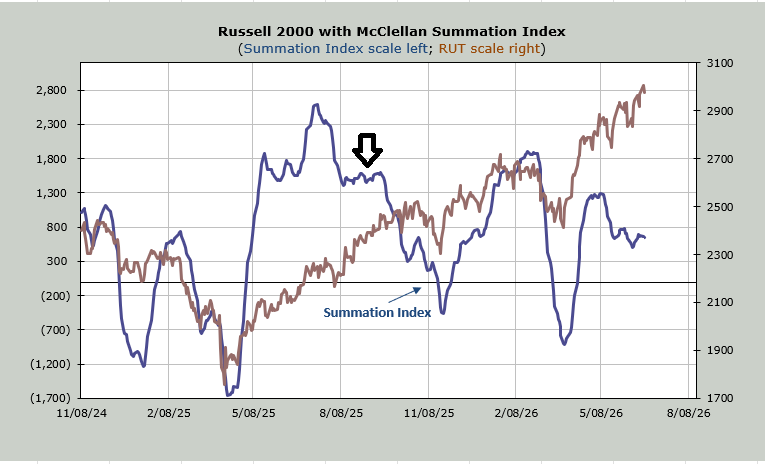
The McClellan Summation Index, despite breadth doing okay and the Russell at the highs, cannot get out of its own way. It reminds me a bit of last August when the index climbed, but the indicator churned.
Q&A/Reader’s Feedback
Helene welcomes your questions about Top Stocks and her charting strategy and techniques. Please send an email directly to Helene with your questions. However, please remember that TheStreet.com Top Stocks is not intended to provide personalized investment advice. Email Helene here.
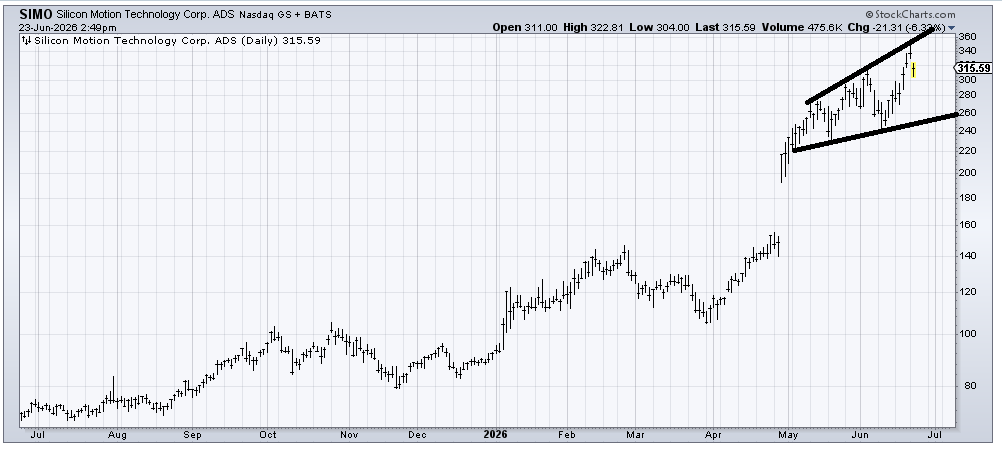
Silicon Motion (SIMO) hasn’t done anything wrong yet, but the chart, at least for the last two months, has been trading between these two lines, so unless/until that ends, this is the pattern we have. Thus, you buy at the lower line and sell at the upper. Then the risk/reward is good because you know quickly if you are wrong, because the pattern has changed.
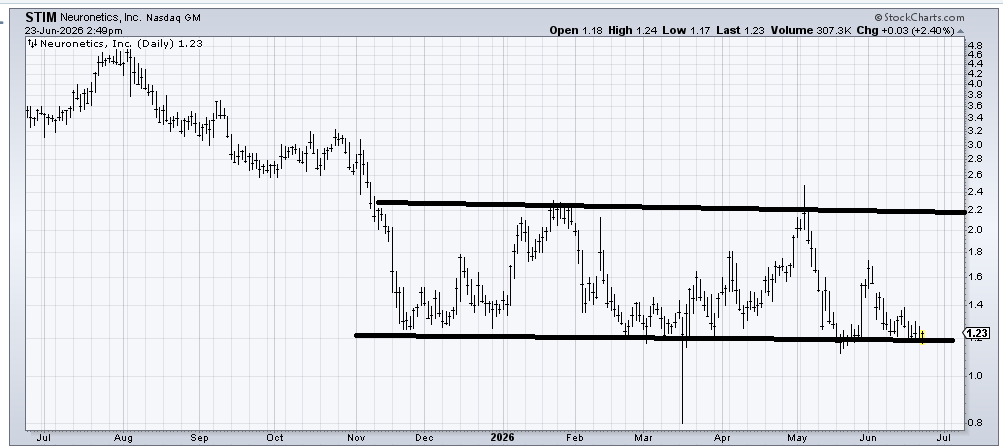
Whoever asked me about Nueronetics (STIM) knows I am a sucker for charts like this. The stock has traded in this one-point range for nearly seven months. That means the risk/reward at 1.20 is good because if it cracks under here, like it means it, then you know you are wrong.
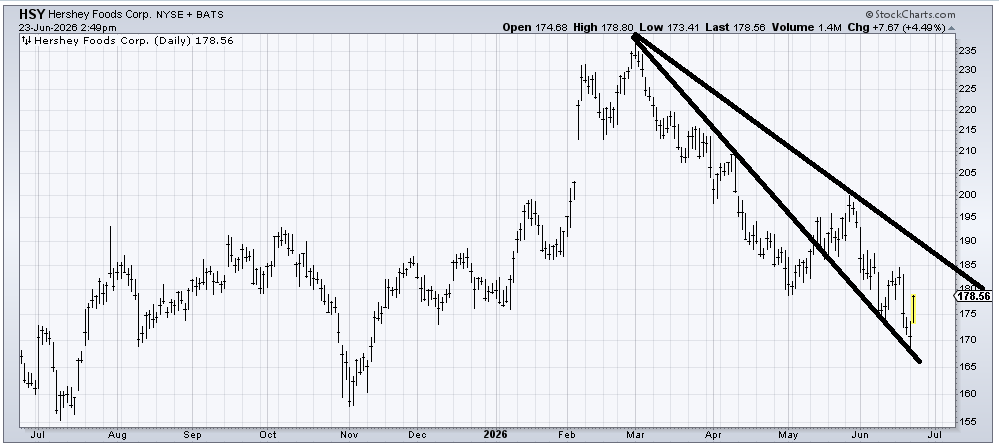
I see no reason Hershey (HSY) can’t rally toward that resistance line (about 190 this week, but 185 next week). It would be great if it could get over that resistance (downtrend) line, but the stock has been making lower lows and lower highs since March, so I think I would wait to see if it can. Play the short-term rally and then see if it can cross the line.
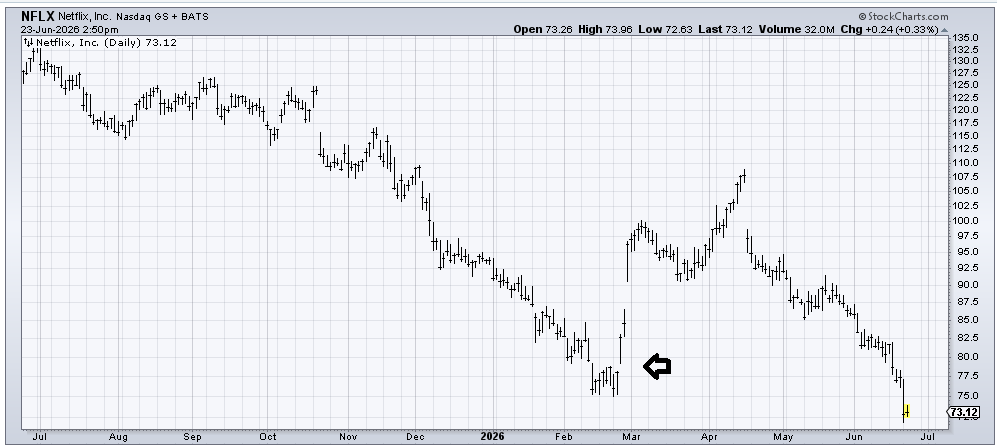
I really thought Netflix (NFLX) would come down to that 75-77 area and bounce. There is a gap there and minor support from February, but like so many of the charts we looked at the other day, support didn’t matter. It is very oversold, and the TV folks did finally notice it this week, but I would say if it can’t get up and over 78 in a hurry, then it’s time to sell it.
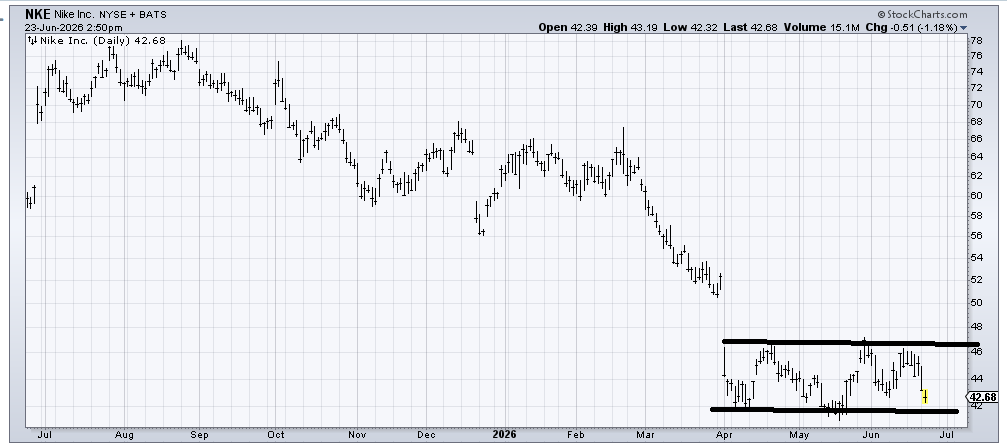
Nike (NKE) is still trying to form a bottom, but it is not doing a great job of it. It couldn’t even make a higher high in mid-June (vs early June). A break of 42 is bearish.