Redfin Builds a Base Formation But Is a It a Buy?
Let's check the charts of this real estate name and see how to play it.
You've reached your free article limit
You've read 0 of 1 free Pro articles.
Redfin Corporation RDFN provides residential real estate brokerage and mortgage origination services. I have seen their signs in the windows of some of the houses in my neighborhood.
Let's check out the charts and indicators.
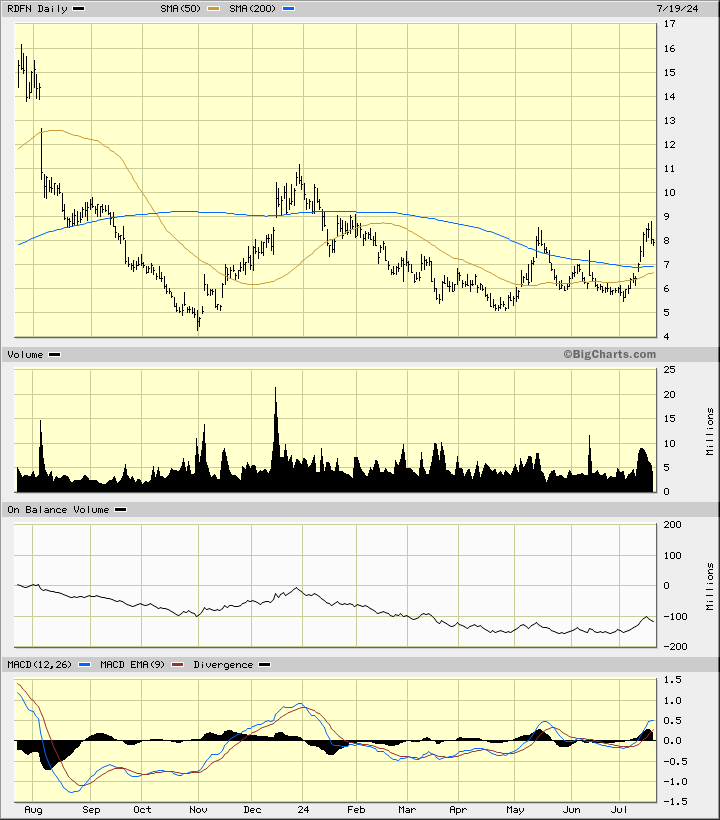
In this daily bar chart of RDFN, below, I can see how prices have behaved in the past twelve months. Prices have found buying interest in the $6-$4 area since October. Prices are trading above the rising 50-day moving average line and above the bottoming 200-day line. The On-Balance-Volume (OBV) line shows a decline into June followed by the beginning of a rise. The Moving Average Convergence Divergence (MACD) oscillator is above the zero-line.
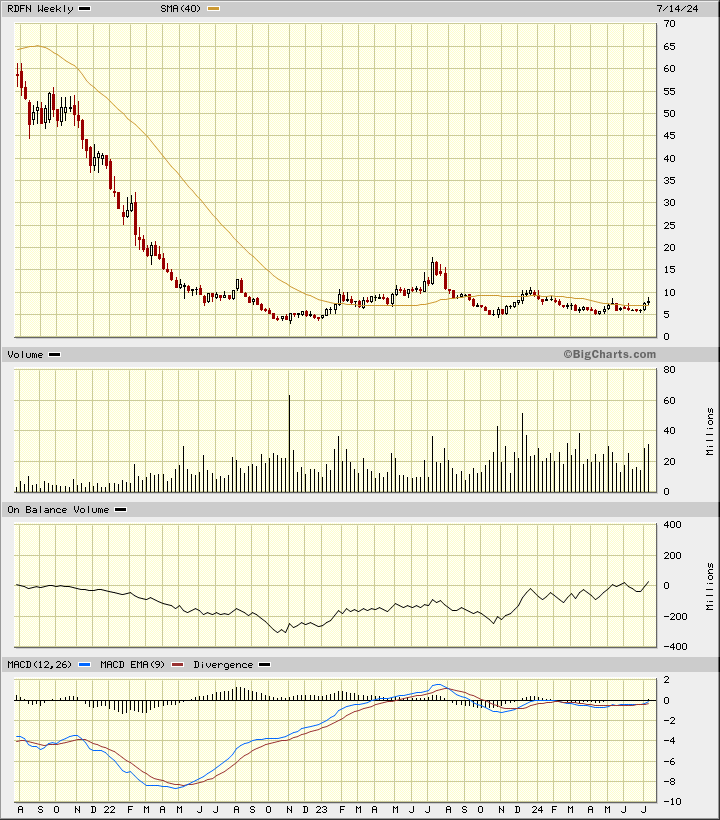
In this weekly Japanese candlestick chart of RDFN, below, I can see that prices have found support the past two years in the $5 area. Impressive. Prices are trading above the 40-week moving average line. The weekly OBV line shows us an uneven advance the past two years or so. The line is not smooth but it does suggest that buyers of RDFN are more aggressive than sellers. The MACD oscillator has been improving in recent weeks and is very close to crossing above the zero-line.
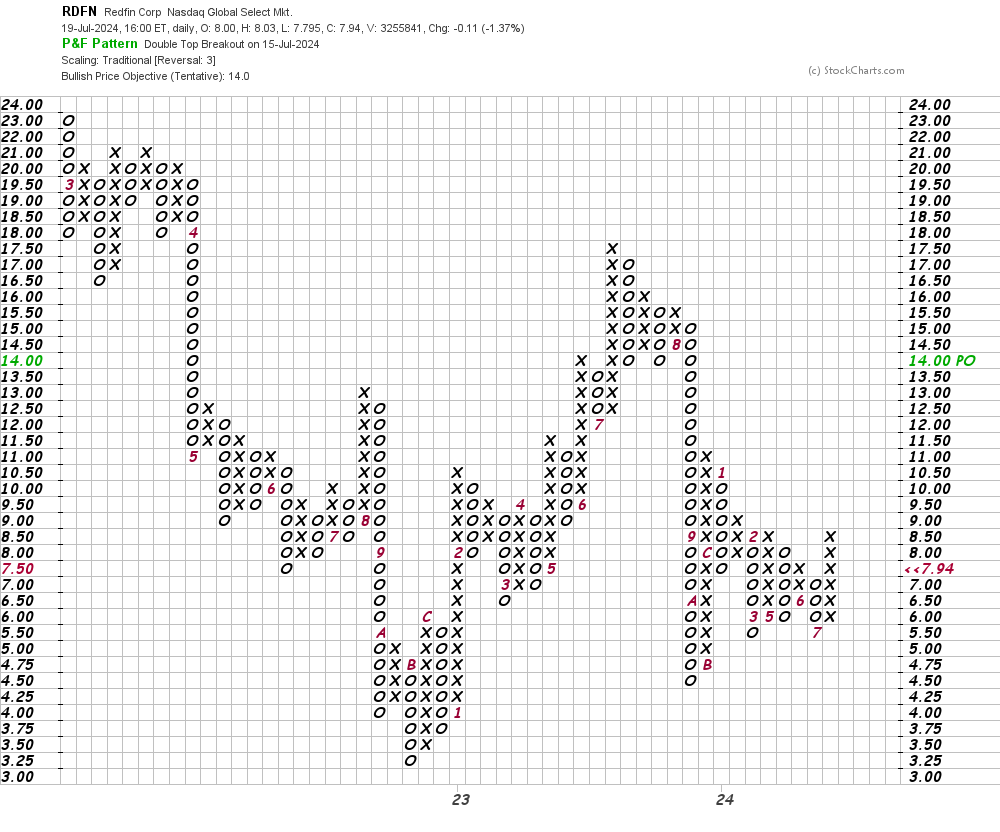
In this daily Point and Figure chart of RDFN, below, I can see a low in 2022 and a higher low in 2023-2024. An upside price target in the $14 area is being projected by the software.
In this weekly Point and Figure chart of RDFN, below, I can see a price target in the $14 area just like the daily chart above.
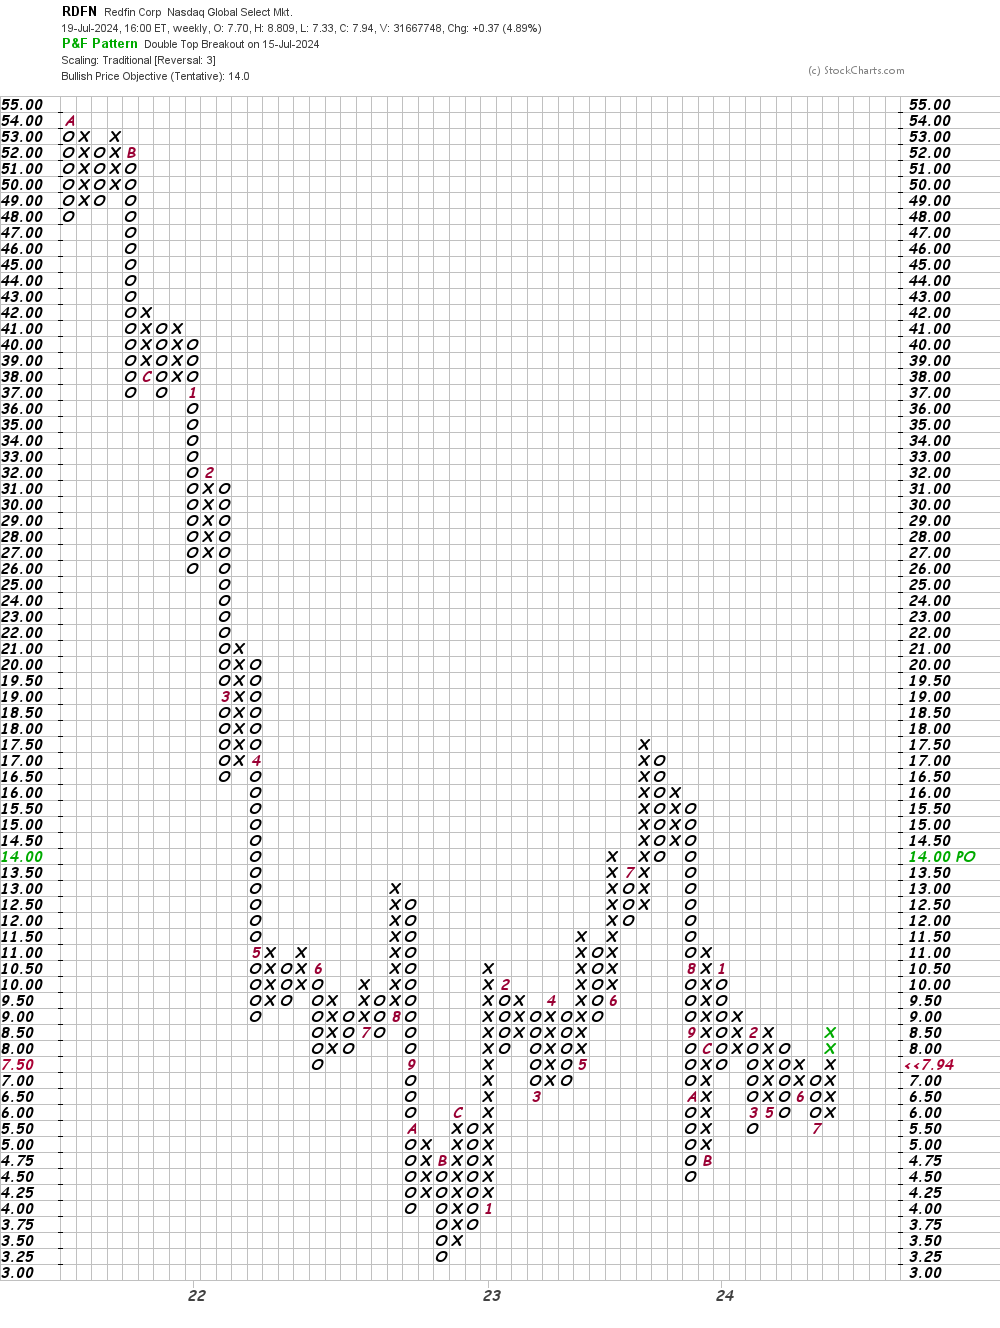
Bottom line strategy: Aggressive traders could go long RDFN, below, at current levels provided that they can afford to risk a decline to the $5 area. $14 is my upside price target for now.
Employees of TheStreet are prohibited from trading individual securities.