After Big Rally, Semiconductor Name Offers Intriguing Opportunity
A major semiconductor and wireless telecom company has seen a major surge and investors are wondering whether to buy or sell.
You've reached your free article limit
You've read 0 of 1 free Pro articles.
Qualcomm QCOM designs and manufactures semiconductors and wireless telecommunications products. The stock made a big rally into late June and has been correcting that strong advance in recent days. Should traders get prepared for a buying opportunity or will it be better to sell the rally?
Let's check out the charts and indicators.
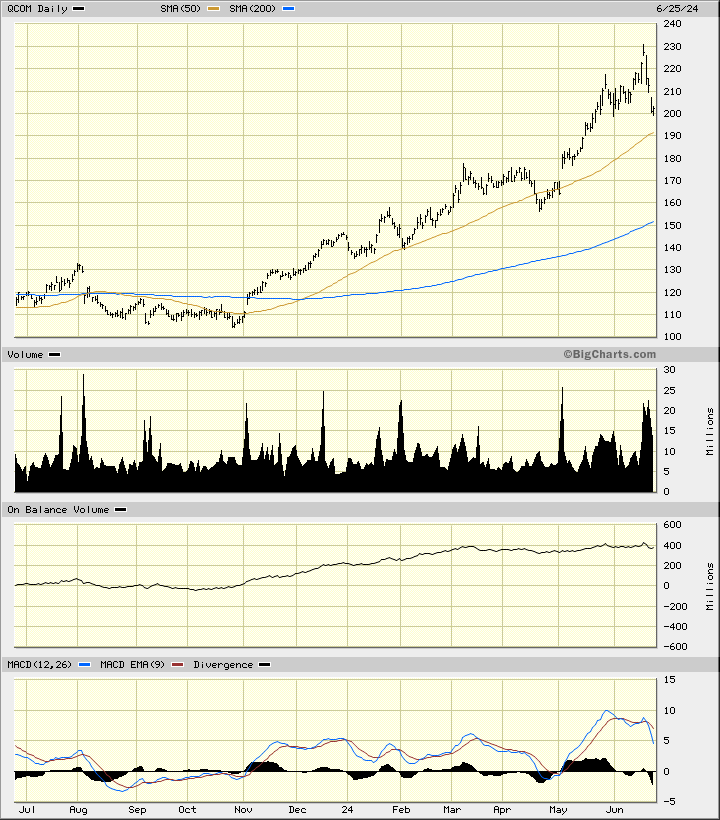
In this daily bar chart of QCOM below, I can see that prices more than doubled in the past 12 months. Prices have corrected sharply to the downside in recent days. The rising 50-day moving average line is now not far below the market. The rising 200-day moving average line intersects down around $150. The daily On-Balance-Volume (OBV) line has been flat or neutral the past four months. The Moving Average Convergence Divergence (MACD) oscillator has been correcting to the downside since late May.
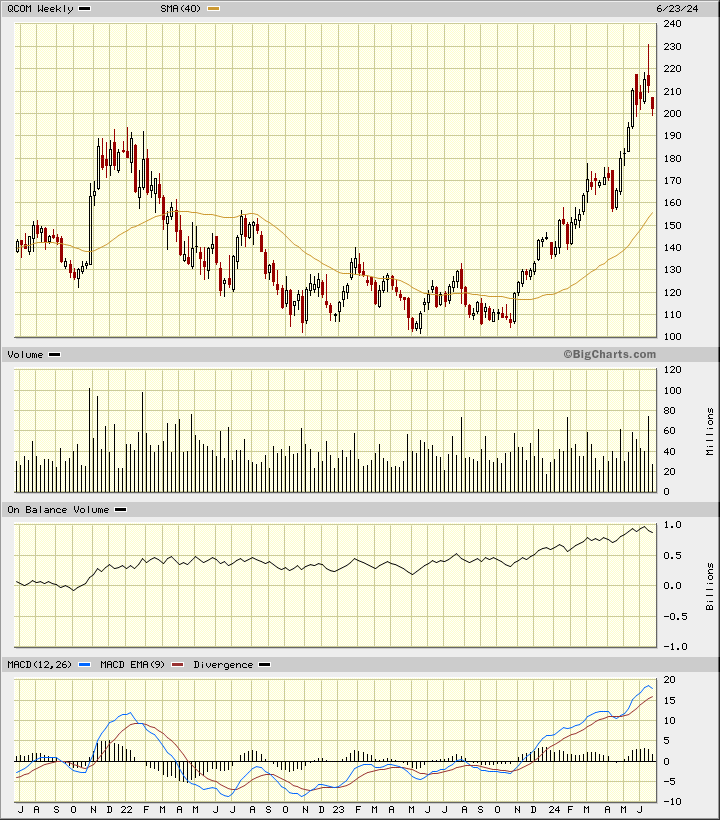
In this weekly Japanese candlestick chart of QCOM below, I can see the sharp advance of the past few months. The two most recent candles show us a large upper shadow followed by a bearish (red) candle to generate a top reversal. Top reversals can result in a move to the downside or a move sideways. The weekly OBV line shows us a choppy advance into May/June. The MACD oscillator is in a move higher but has been narrowing in recent weeks which indicates that the trend strength is weakening.
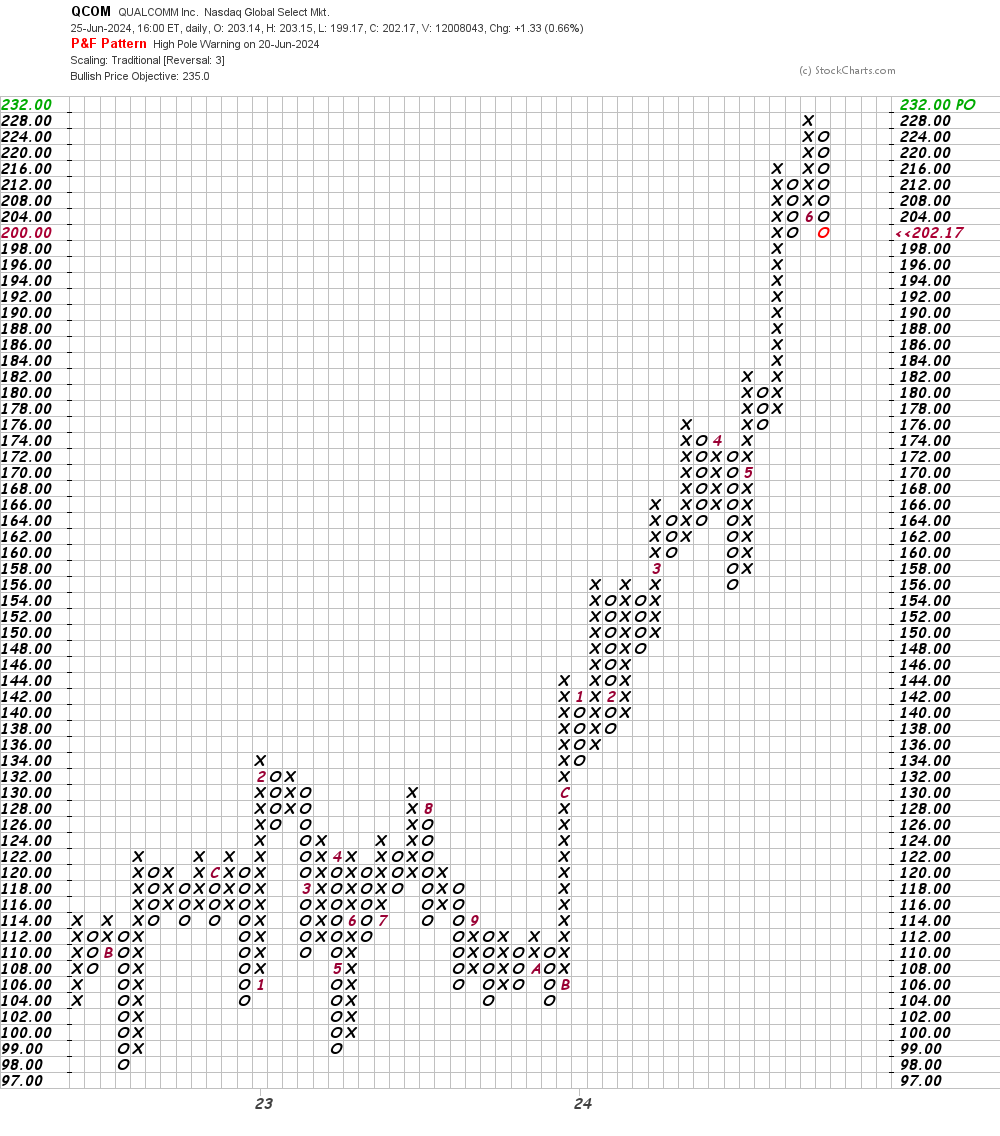
In this daily Point and Figure chart of QCOM below, I can see that the software is projecting a not far away price target in the $235 area.
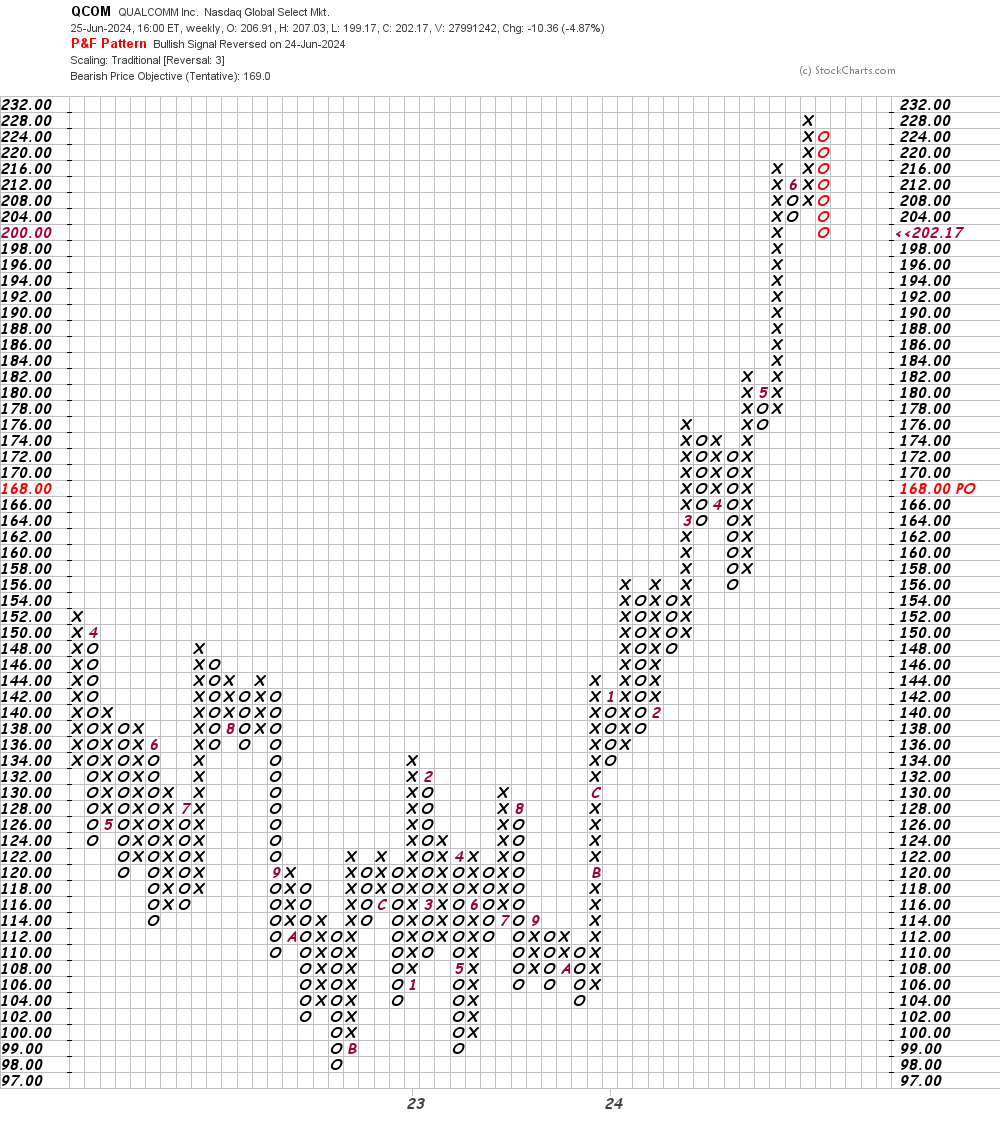
In this weekly Point and Figure chart of QCOM below, I can see a potential downside price target in the $169 area.
Bottom line strategy: I was bearish on QCOM in my February 1, 2024 review. I feel like a broken record if I repeat myself with a bearish view.
In the short-run QCOM could bounce to the upside but the weekly candle chart and the weekly Point and Figure chart suggest we should not rush in as buyers.
Employees of TheStreet are prohibited from trading individual securities.