Trade Qualcomm Here? It's a Coin Toss
Let's see what the charts and indicators have to say.
You've reached your free article limit
You've read 0 of 1 free Pro articles.
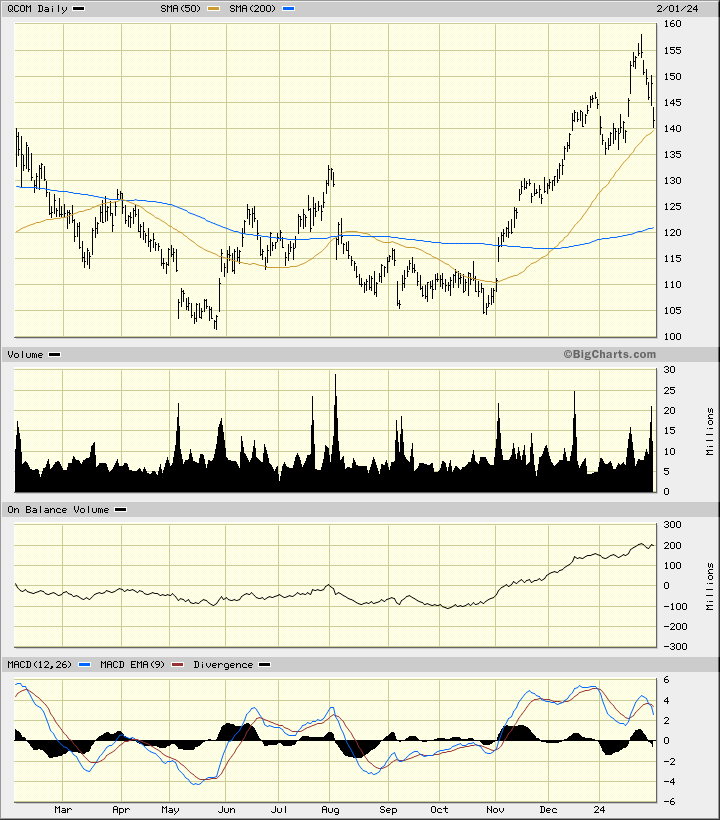
Semiconductor maker Qualcomm QCOM was raised to a buy recommendation Thursday at Fubon with a $175 price target. Over at Citigroup QCOM was cut to neutral with a price target of just $160. Confused? Let's check and see if the charts and indicators are giving us clear signals.
In this daily bar chart of QCOM, below, I can see that prices have pulled back to the rising 50-day moving average line. Prices found buying interest (support) in the $140-$135 area in early January but I am not 100% sure that this area will hold if traders pay more attention to the downgrade instead of the upgrade.
The On-Balance-Volume (OBV) line shows us strength from October, but the indicator looks stalled at the end of January. The Moving Average Convergence Divergence (MACD) oscillator made a lower high in January versus December even as prices made higher highs. This is a bearish divergence and could foreshadow weaker prices ahead.
In this weekly Japanese candlestick chart of QCOM, below, I see a "coin toss" chart - really. The two most recent candles are the problem - the first candle shows us a large upper shadow as traders rejected the highs and the second candle shows us a large lower shadow. Prices trade above the rising 40-week moving average line.
The weekly OBV line improved from October but shows the start of weakness in January. The MACD oscillator is above the zero line but has narrowed in recent weeks. The trend strength has begun to weaken.

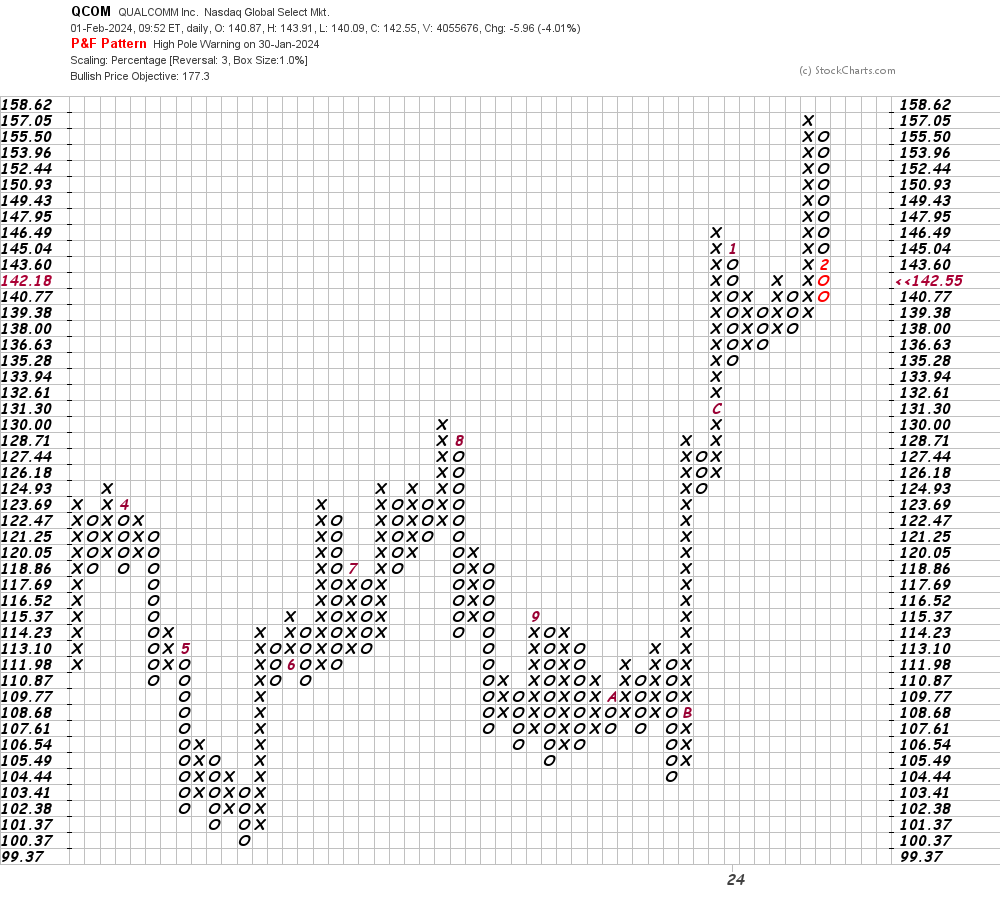
In this daily Point and Figure chart of QCOM, below, I can see an upside price target in the $177 area. A trade at $136.63 will probably weaken this chart picture.
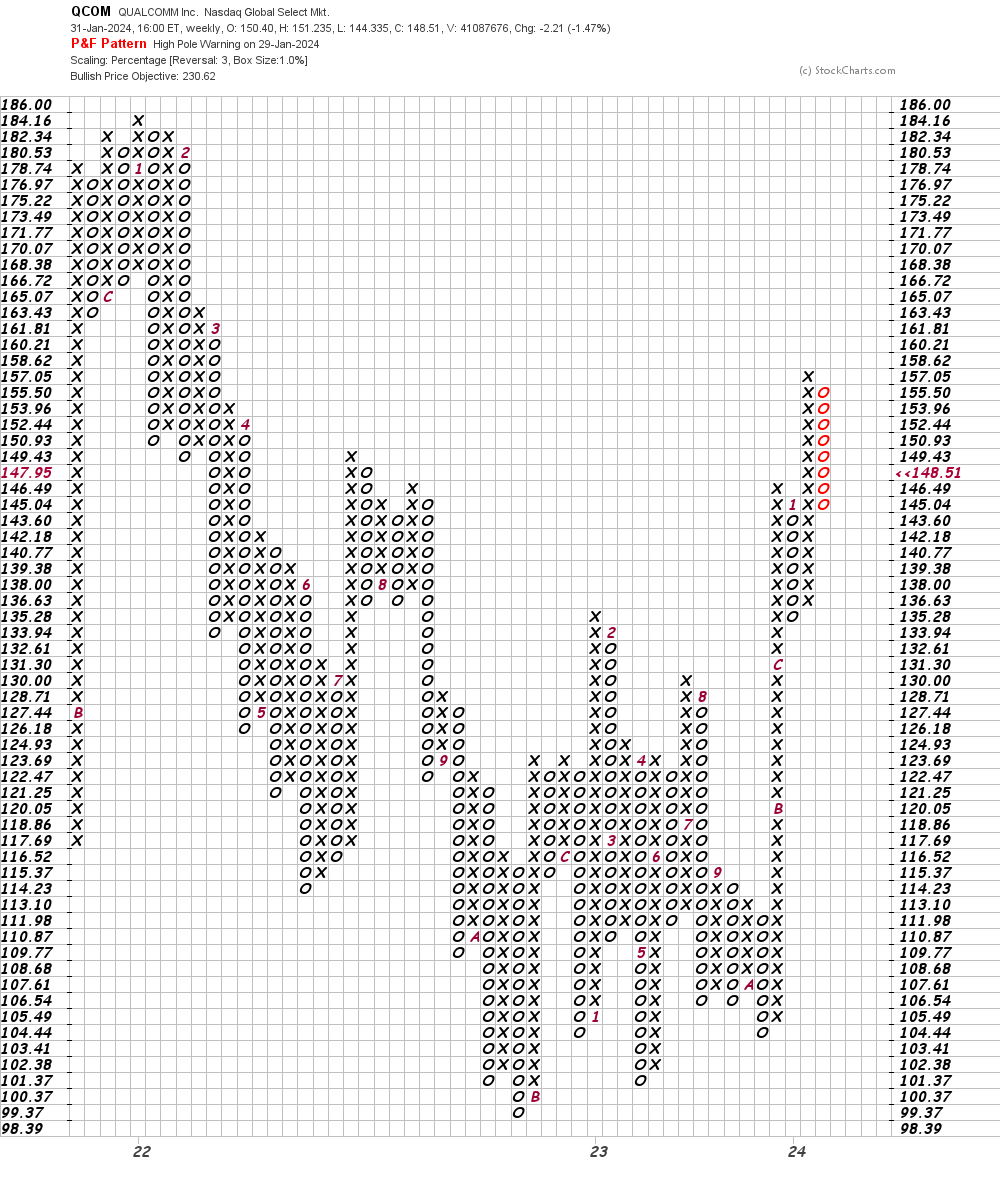
In this weekly Point and Figure chart of QCOM, below, the software is showing us an upside price target in the $231 area.
Bottom line strategy: Wall Street, you gotta love it. One analyst is bullish and the other is bearish. Not much different than technicians. Right? The charts are mixed but I get the sense that lower prices are in the forecast for QCOM.
(Qualcomm is a holding in the Action Alerts PLUS member club. Want to be alerted before AAP buys or sells QCOM? Learn more now.)
Employees of TheStreet are prohibited from trading individual securities.