PPG Industries Could Paint the Charts Red
Here's what may produce a deeper decline in the stock.
You've reached your free article limit
You've read 0 of 1 free Pro articles.
PPG Industries PPG lowered its organic sales growth outlook Thursday night. The paint and coatings maker reported non-GAAP EPS of $2.50, which beat estimates by $0.02, and revenue of $4.79 billion, which missed by $130 million.
Let's check out the charts and indicators before the paint dries.
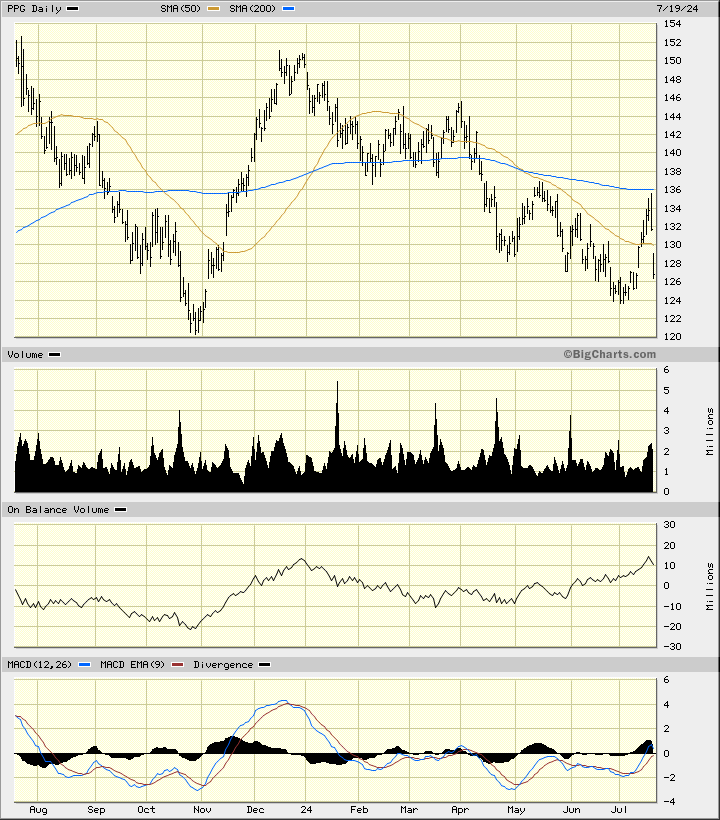
In the daily bar chart of PPG, below, I can see a pattern of lower highs since December. The shares have just gapped below the declining 50-day moving average line. Prices have traded below the 200-day line for a while now.
The daily On-Balance-Volume (OBV) line has moved up since March but could be making a fresh peak now. The Moving Average Convergence Divergence (MACD) oscillator has moved up to the underside of the zero line.
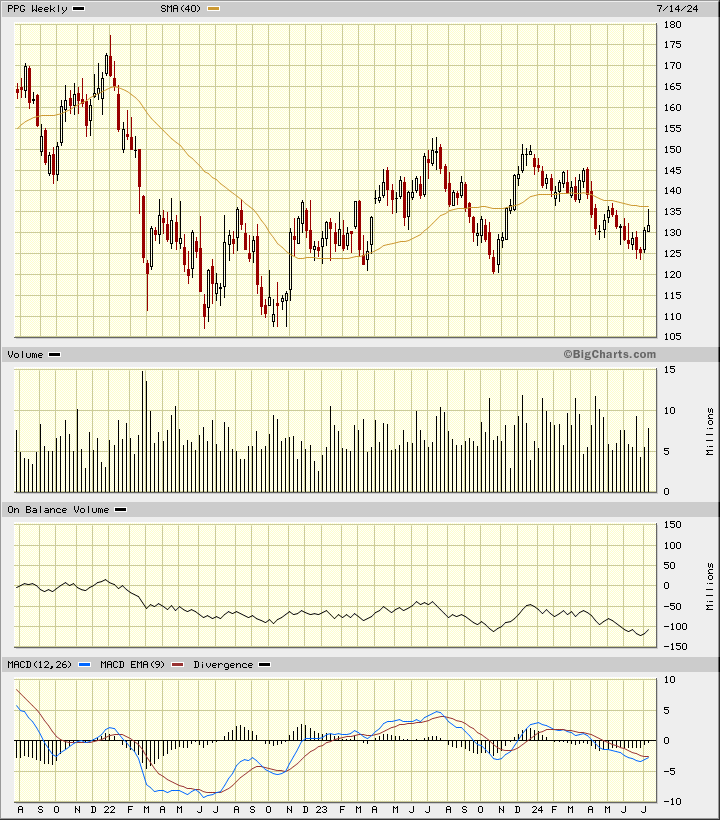
In the weekly Japanese candlestick chart of PPG, below, I see a picture that opens the way to further declines. The shares trade below the declining 40-week moving average line. The most recent candle pattern shows a large upper shadow as traders reject the highs.
The weekly OBV line has been weak the past three years. The MACD oscillator is below the zero line but trying to signal a cover shorts buy signal.
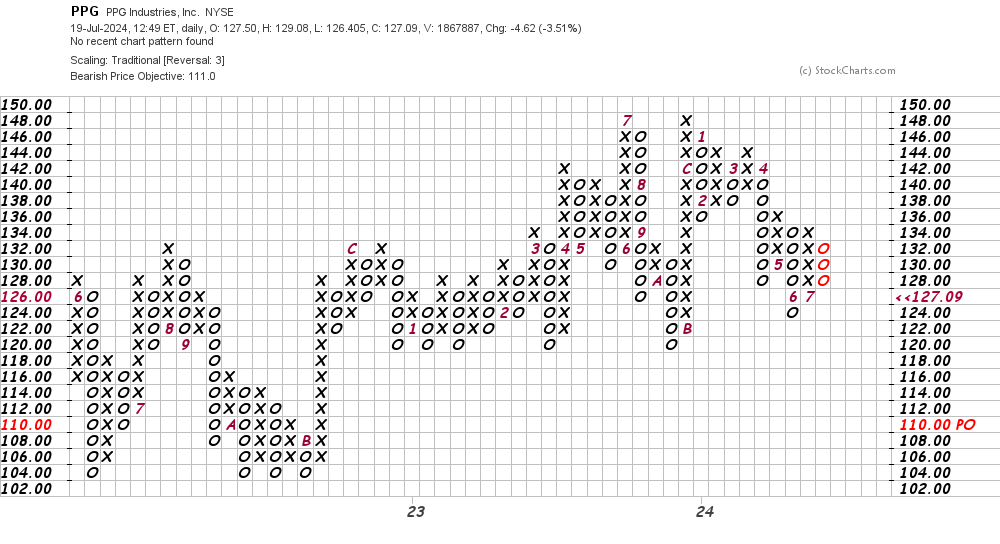
In this daily Point and Figure chart of PPG, below, I can see a potential downside price target in the $111 area.
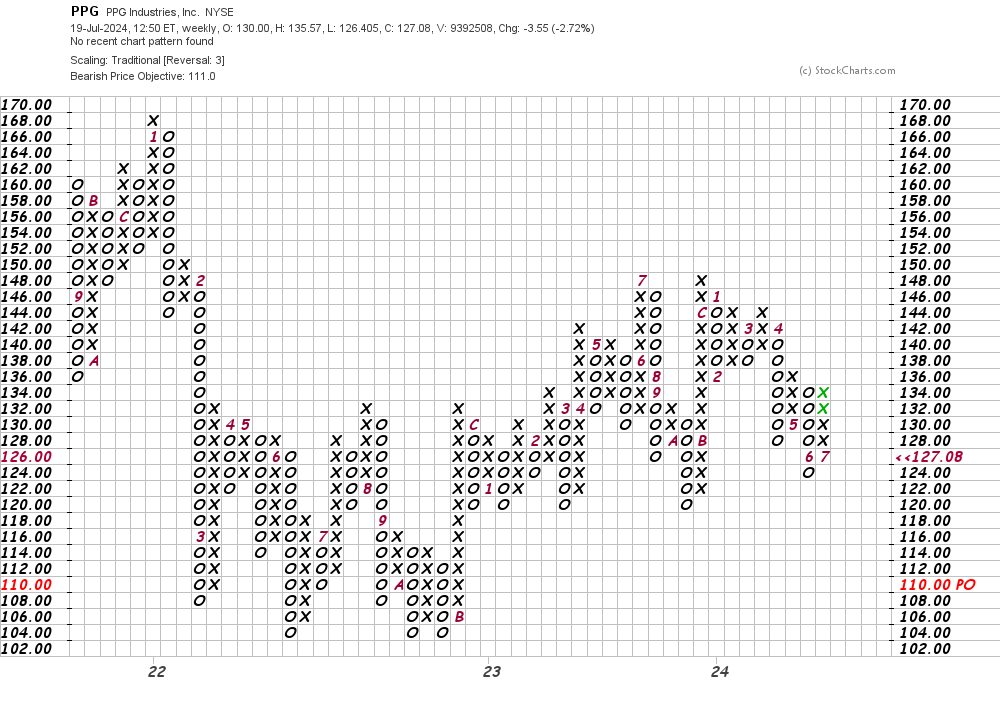
In this weekly Point and Figure chart of PPG, below, I can see the same $111 downside price target as the daily chart above.
Bottom-line strategy: PPG looks like it will at least retest the $125-$120 area and if buying interest does not materialize we could see a deeper decline.
Employees of TheStreet are prohibited from trading individual securities.