Plug Power Is Finally Building a Base Pattern
Is this the light at the end of the tunnel?
You've reached your free article limit
You've read 0 of 1 free Pro articles.
The share price of Plug Power PLUG has disappointed investors for several years now. Has the situation changed?
Let's check the charts and indicators.
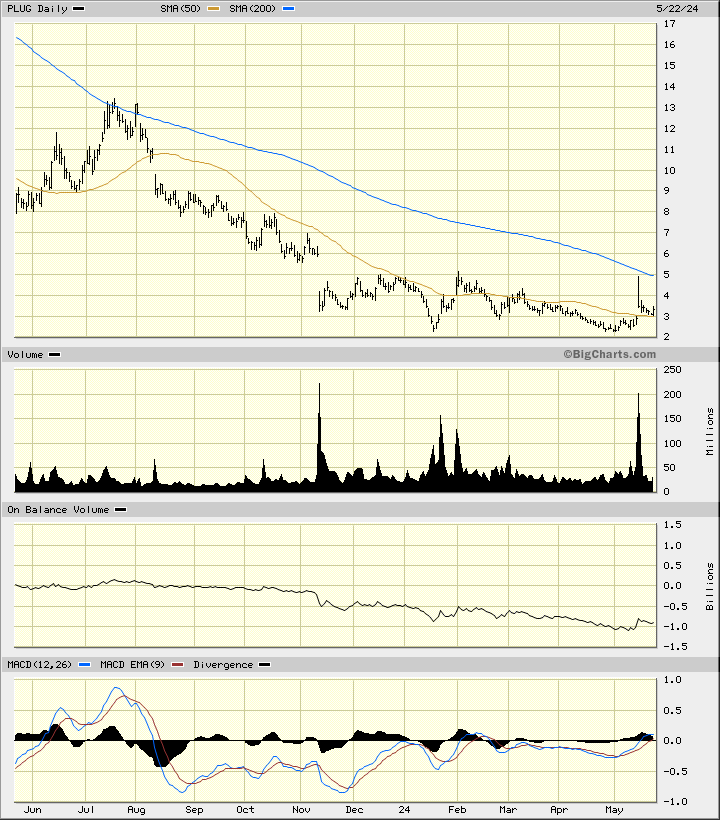
In this daily bar chart of PLUG, below, I can see that prices have moved sideways to slightly lower since November. Prices have firmed above the 50-day moving average line and recently rallied to the underside of the still declining 200-day moving average line. The trading volume has been more active since November and could suggest that investors are showing greater interest in the stock.
The On-Balance-Volume (OBV) line shows a decline into early May and perhaps the start of a new firming trend - we'll see. The Moving Average Convergence Divergence (MACD) oscillator is trying to cross above the zero line now for an outright buy signal.
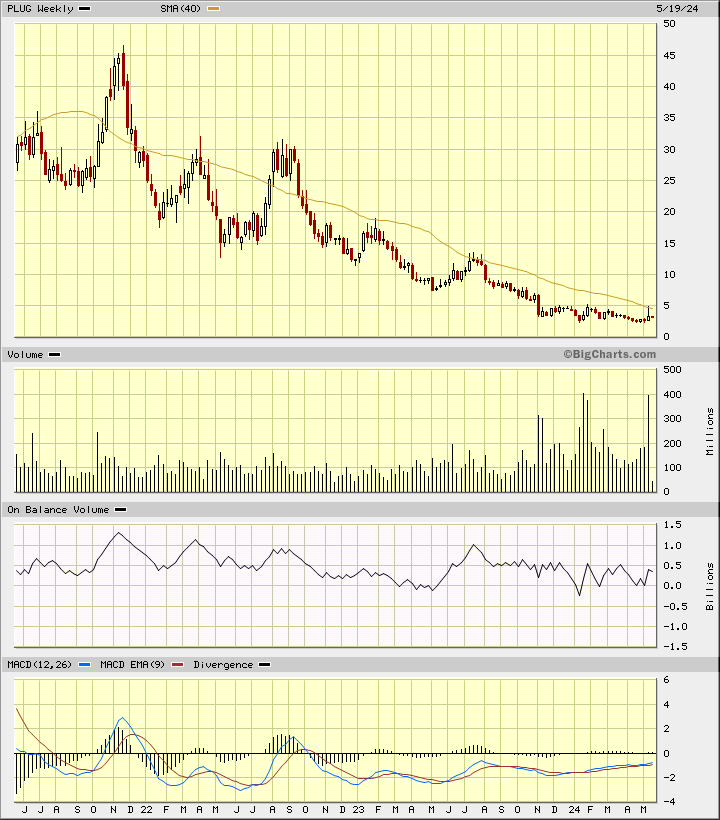
In this weekly Japanese candlestick chart of PLUG, below, I can see that PLUG has been in a longer-term downtrend but that may be coming to an end. Prices are poised to test and maybe break the declining 40-week moving average line.
The weekly OBV line has moved sideways for the past twelve months. The MACD oscillator shows improvement since December but still remains below the zero line.
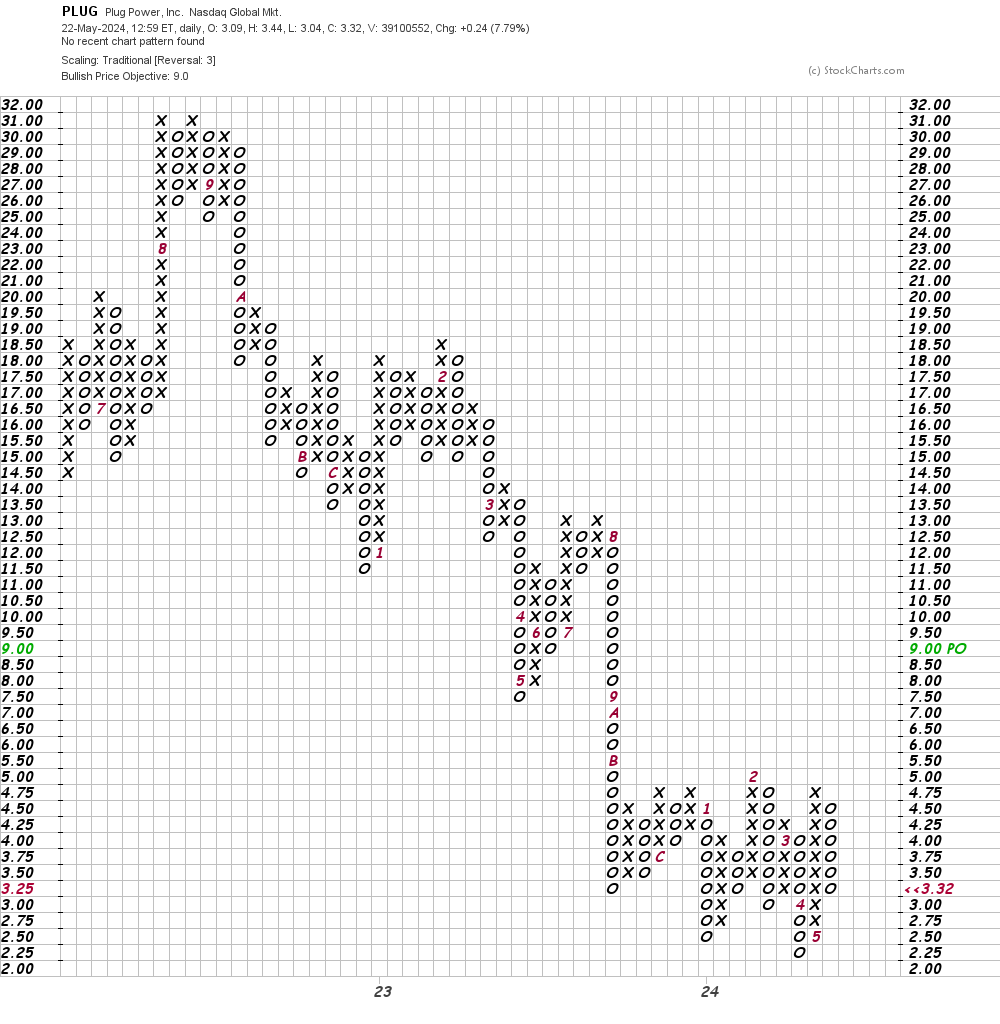
In this daily Point and Figure chart of PLUG, below, I can see an upside price target in the $9 area.
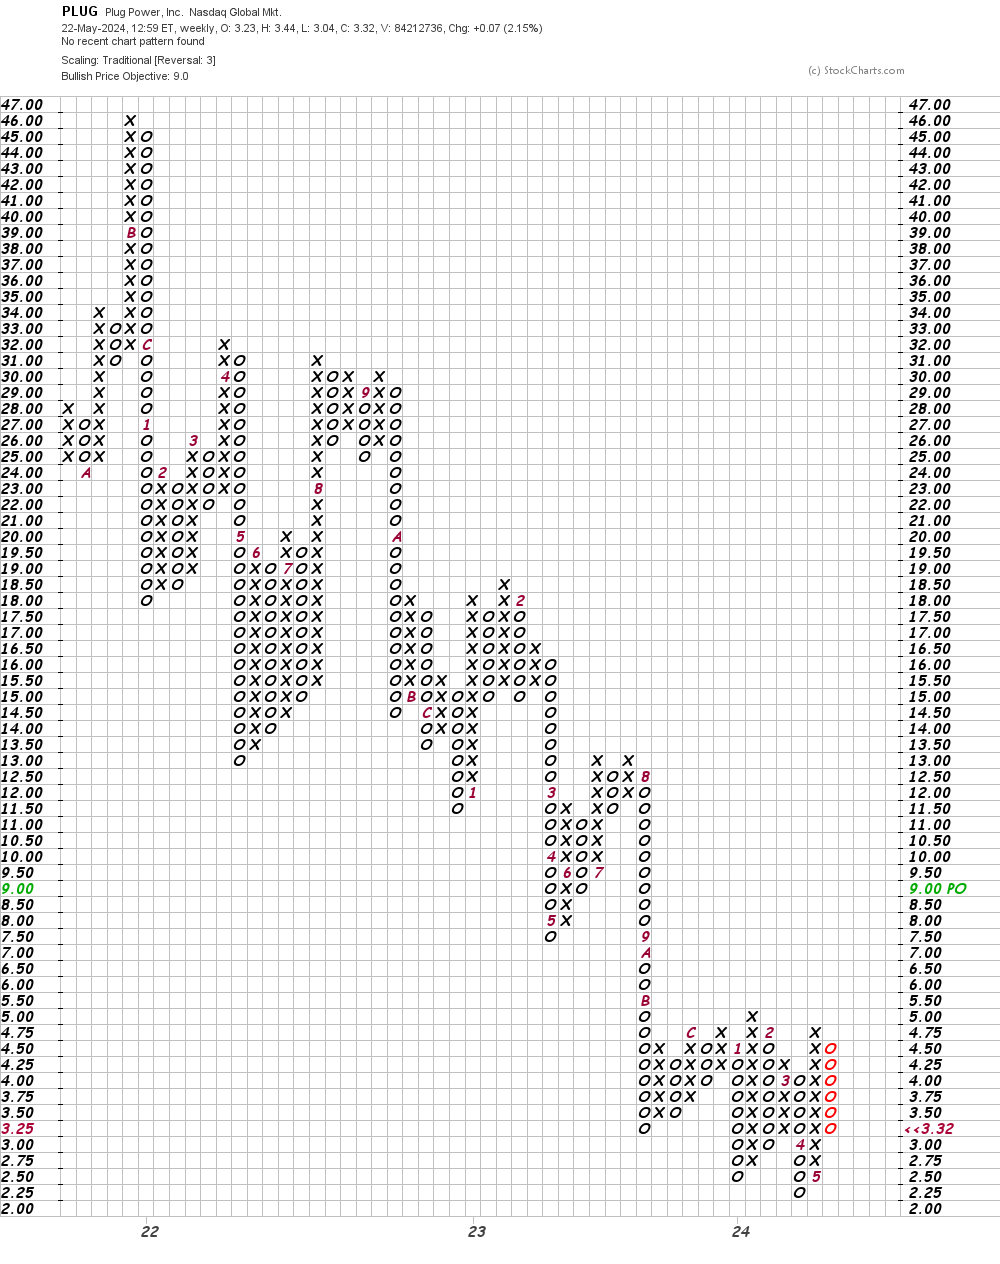
In this weekly Point and Figure chart of PLUG, below, I can see the same $9 price target as shown on the daily chart above.
Bottom line strategy: PLUG investors have been disappointed for years but maybe this is the light at the end of the tunnel.
Employees of TheStreet are prohibited from trading individual securities.