Plotting a Technical Strategy for Regions Financial
Share prices have turned sideways after a rally from October to late December.
You've reached your free article limit
You've read 0 of 1 free Pro articles.
Regions Financial Corp. RF was raised to a fundamental "buy" recommendation Monday at Citi with a $23 price target. Let's check out the charts and indicators of this regional bank name.
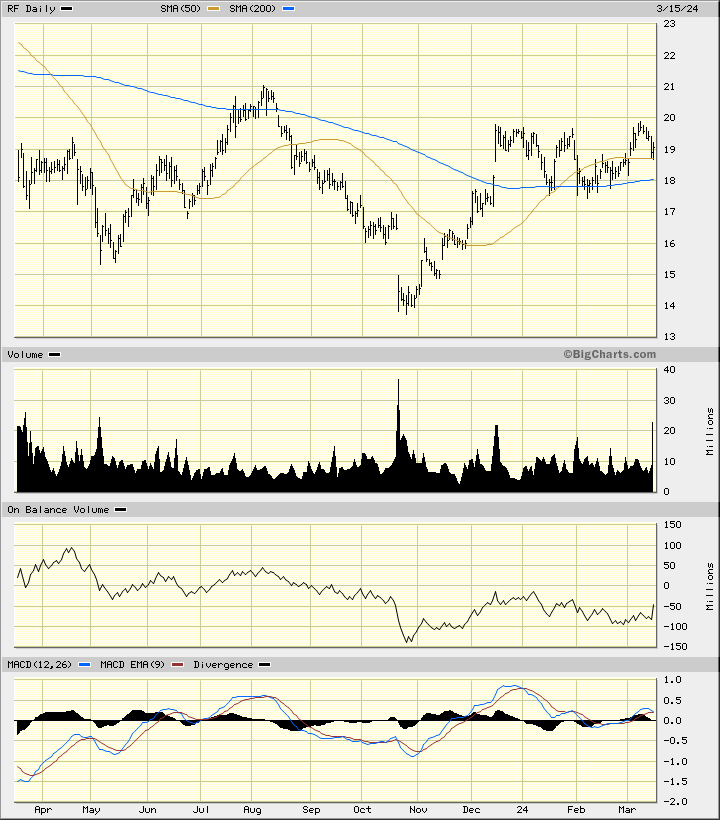
In the daily bar chart of RF, below, a low in October stands out on the chart. It is a "V" bottom with a volume spike at the low. Share prices have turned sideways after a rally from October to late December. RF is trading just slightly above the 50-day moving average line and above the 200-day moving average line.
The On-Balance-Volume (OBV) line made a low in October and so far a higher low in February. The Moving Average Convergence Divergence (MACD) oscillator is above the zero line but curving lower towards perhaps a new sell signal.
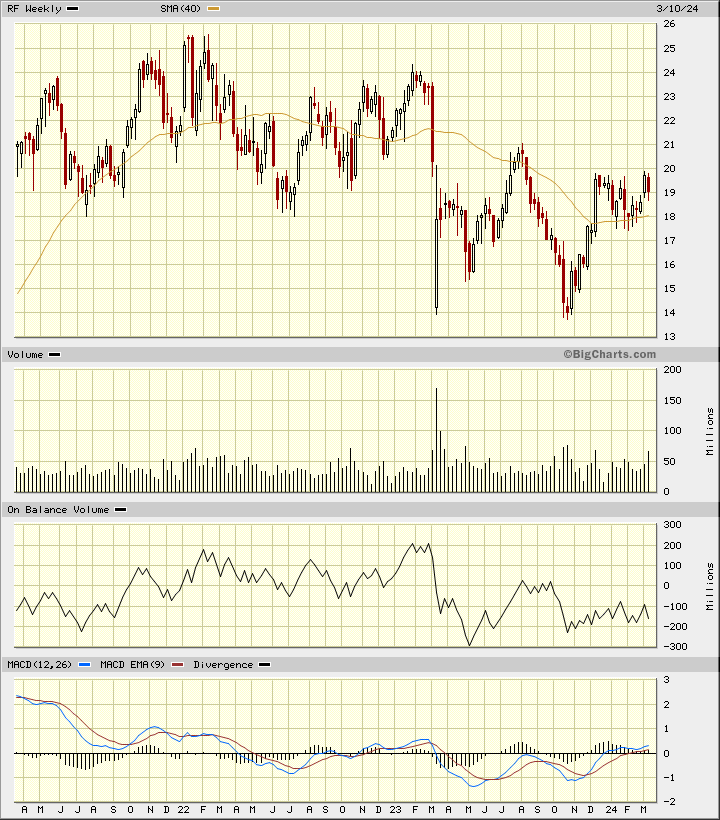
In the weekly Japanese candlestick chart of RF, below, I can see how prices have worked lower in a wide downward-sloping channel. RF trades above the 40-week moving average line.
The weekly OBV line has struggled since a low in May. The MACD oscillator is slightly above the zero line.
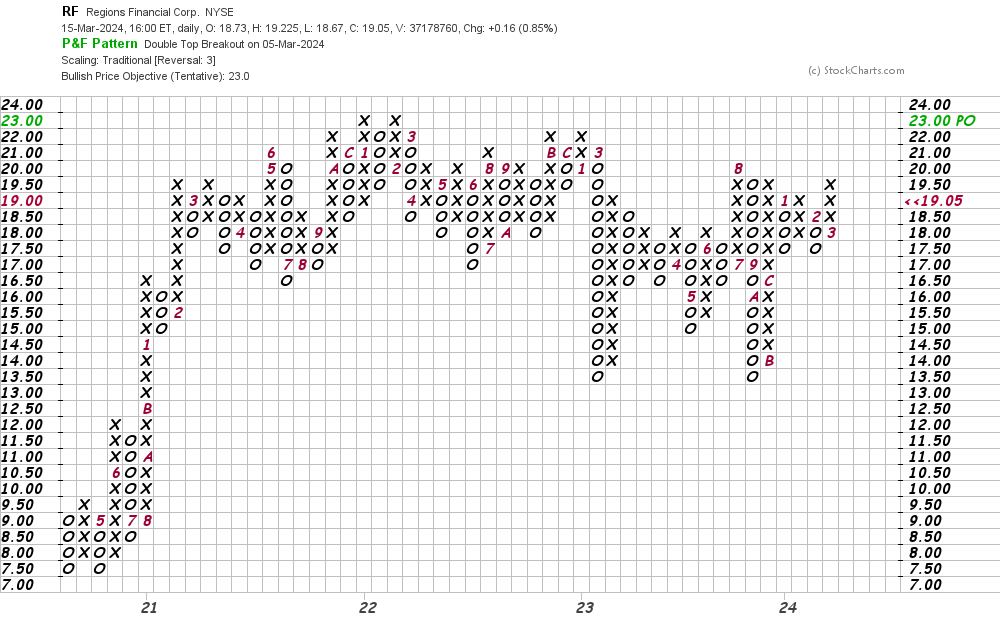
In this daily Point and Figure chart of RF, below, I can see a modest upside price target in the $23 area.
In this weekly Point and Figure chart of RF, below, I can see a $23 price target like the daily chart above.
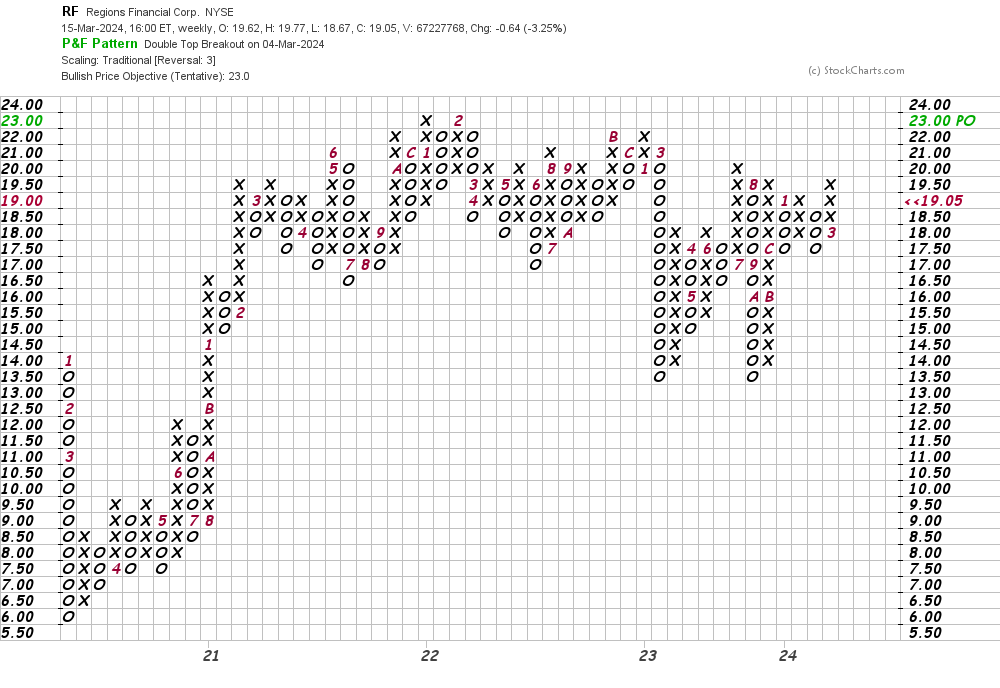
Bottom-line strategy: Traders could probe the long side of RF at current levels risking to $17. Both the technical price target as well as the fundamental target is $23.
Employees of TheStreet are prohibited from trading individual securities.