Paramount Global Bounces Amid Skydance Deal Speculation
Rumors about a merger between Paramount and Skydance are making themselves known in the stock price charts.
You've reached your free article limit
You've read 0 of 1 free Pro articles.
News outlets are reporting that a deal for Paramount Global PARA is very close to getting done with Skydance and it may happen by this weekend. The stock has popped higher on Wednesday, but we have seen this movie before.
Let's check the charts because I have no special insights about any proposals for Paramount Global.
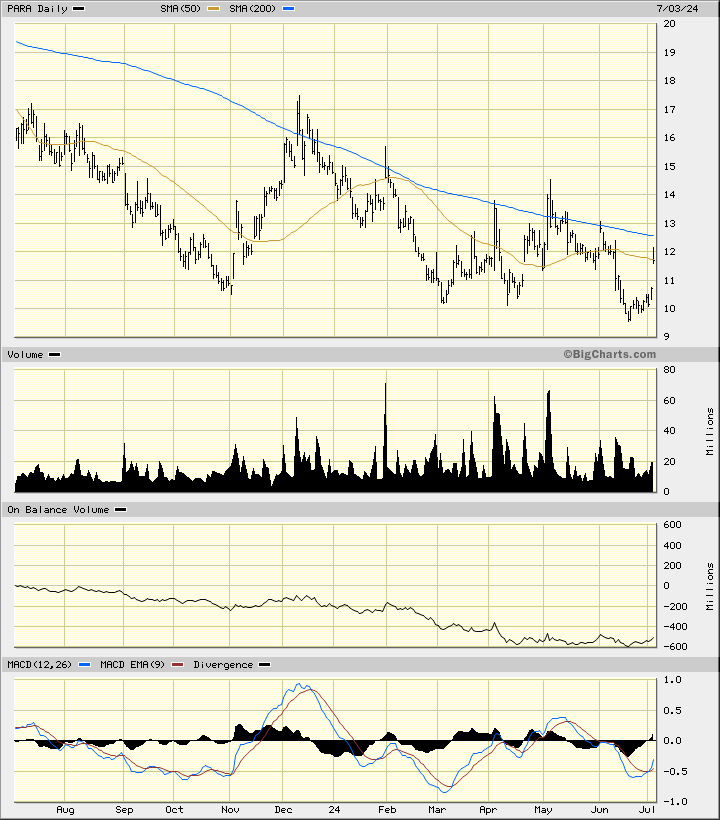
In this daily bar chart of PARA below, I can see that prices have gapped higher to retest the 50-day moving average line. The declining 200-day moving average line intersects around $12.50. The On-Balance-Volume (OBV) line is in a downward trend and depressed. The Moving Average Convergence Divergence (MACD) is below the zero line but poised for a cover shorts buy signal.
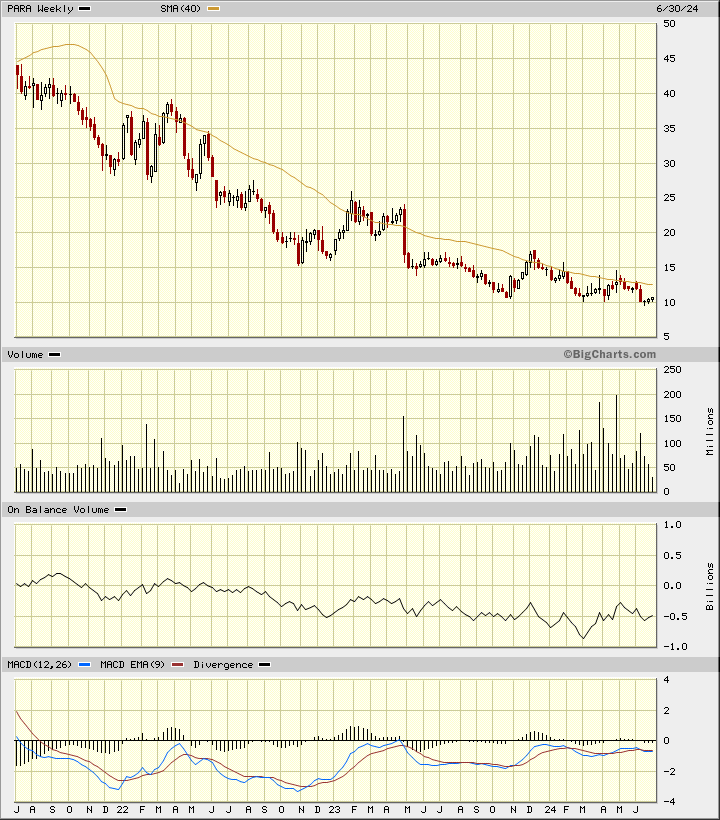
In this weekly Japanese candlestick chart of PARA below, I can see that prices have been in a longer-term bear market. That story is still playing out.
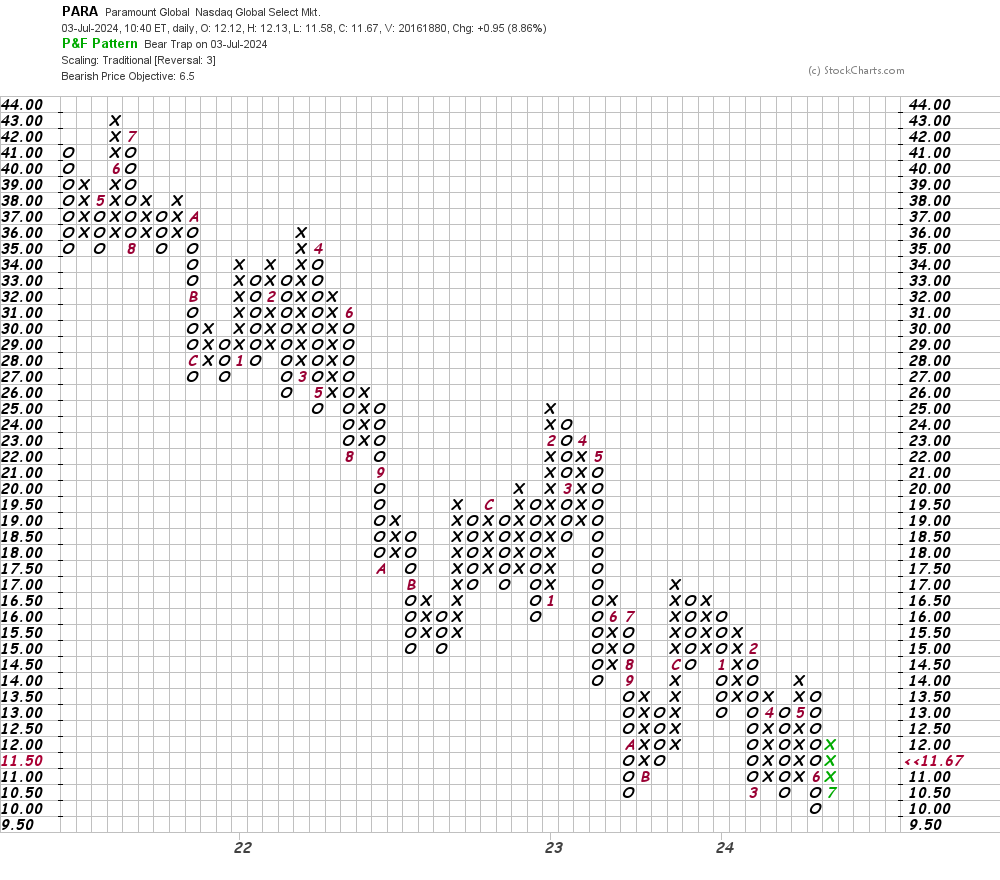
In this daily Point and Figure chart of PARA below, I see a downside price target in the $6 area. A trade at $14.50 or higher is needed to turn this chart positive.
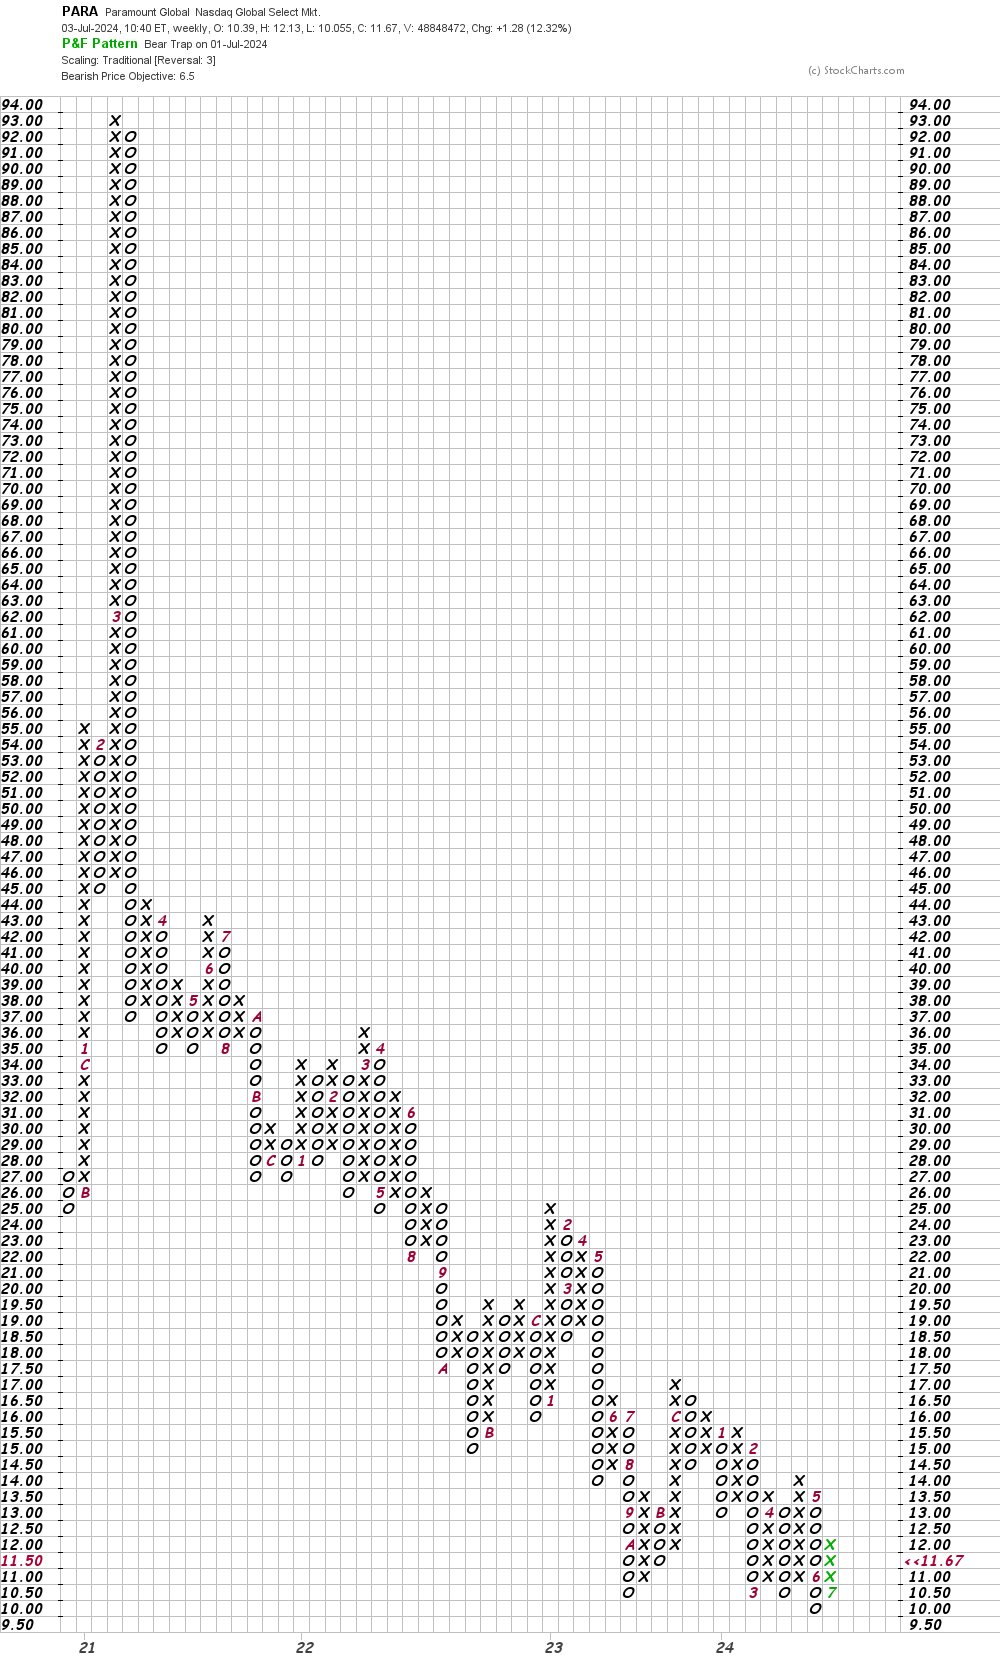
In this weekly Point and Figure chart of PARA below, we can see the price damage done in the past few years. Not pretty.
Bottom line strategy: I have no special knowledge of what is being discussed behind closed doors. The longer-term trend in PARA remains down and I have no trade recommendation.
Employees of TheStreet are prohibited from trading individual securities.