ON Semiconductor Is Gaining Traction, but Can the Rally Continue?
After a second quarter beat, the stock price data for this semiconductor name offers a new price target.
You've reached your free article limit
You've read 0 of 1 free Pro articles.
ON Semiconductor ON rallied after its Q2 beat and a positive outlook was reported this morning. Let's check on the charts and indicators for more.
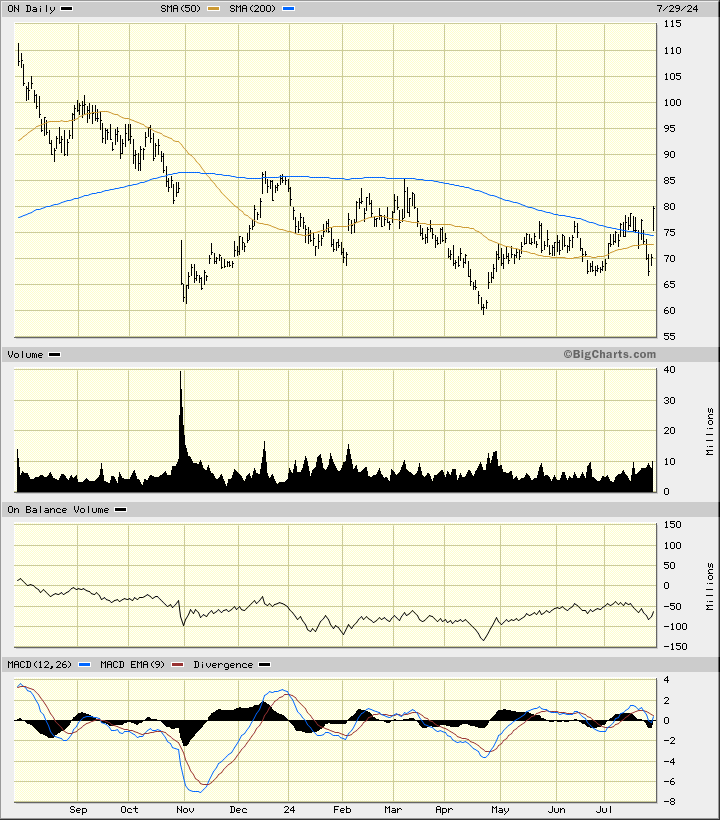
In this daily bar chart of ON, below I can see that prices gapped higher Monday and rallied above the 50-day and 200-day moving averages. Prices also rallied above the highs of the last four months. The On-Balance-Volume (OBV) line has firmed from a low in April and tells me that buyers of ON are being more aggressive than sellers. The Moving Average Convergence Divergence (MACD) oscillator is slightly above the zero line.
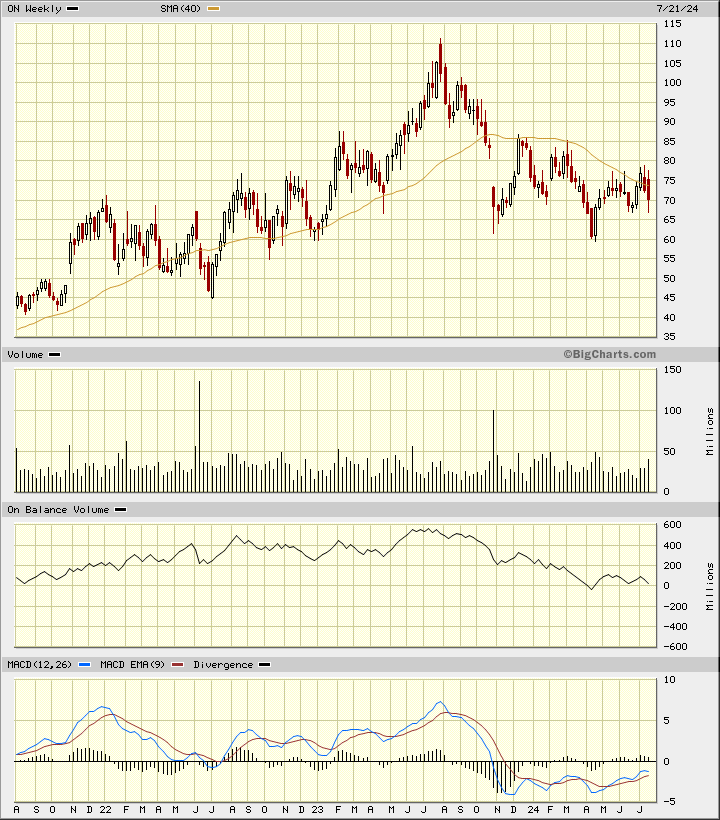
In this weekly Japanese candlestick chart of ON below, I can see an improving technical setup. Prices are currently above the 40-week moving average line but I want to see a weekly close above it. The slope of the 40-week line needs to turn positive and it's not there yet. The weekly OBV line has been weak since last July but could be turning more positive. The MACD oscillator has been improving since April but is still below the zero line.
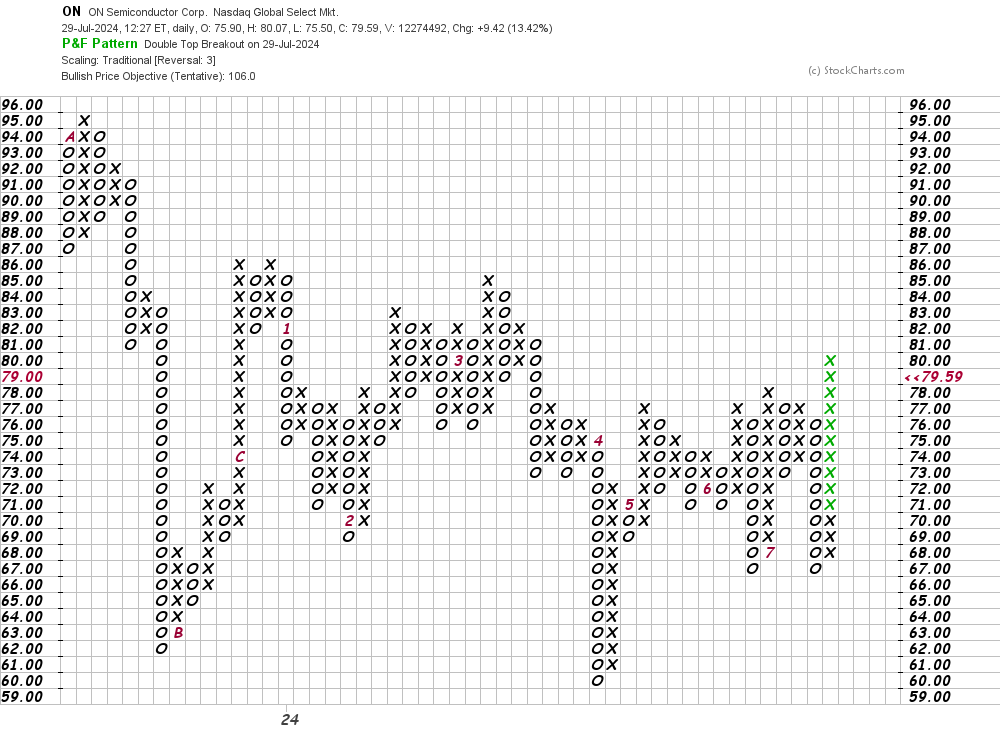
In this daily Point and Figure chart of ON below, I can see an upside price target in the $106 area.
In this weekly Point and Figure chart of ON below, I can see the same upside price target of $106. Strength above $86 to $87 will be encouraging.
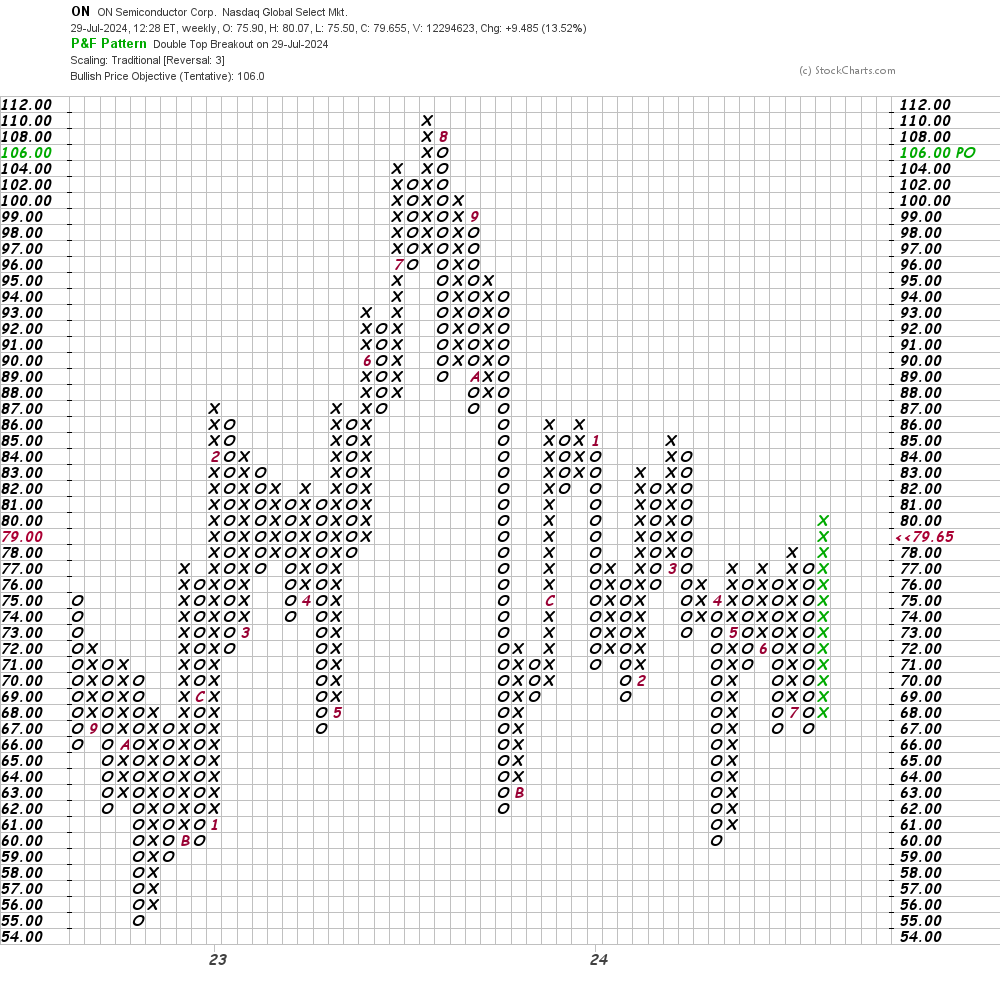
Bottom line strategy: Traders could probe the long side of ON on a one- or two-day shallow dip. Risk to $69. Add to longs above $86. The $106 area is my price target for now.
Employees of TheStreet are prohibited from trading individual securities.