Nike Has Been Running Faster Since We Last Checked in
The stock price charts for Nike suggest there's a solid target for risk-tolerant investors to go long.
You've reached your free article limit
You've read 0 of 1 free Pro articles.
In my March 21, 2024 review of Nike NKE, I wrote that "I have no special information about what NKE will tell shareholders this Thursday evening, but the charts and indicators do not give me confidence in the long side. Strength above $106 is needed to improve the chart picture."
Sell-side firm Morgan Stanley MS supposedly lowered its target price for NKE to $114 per share from $116. Let's go back to the charts again.
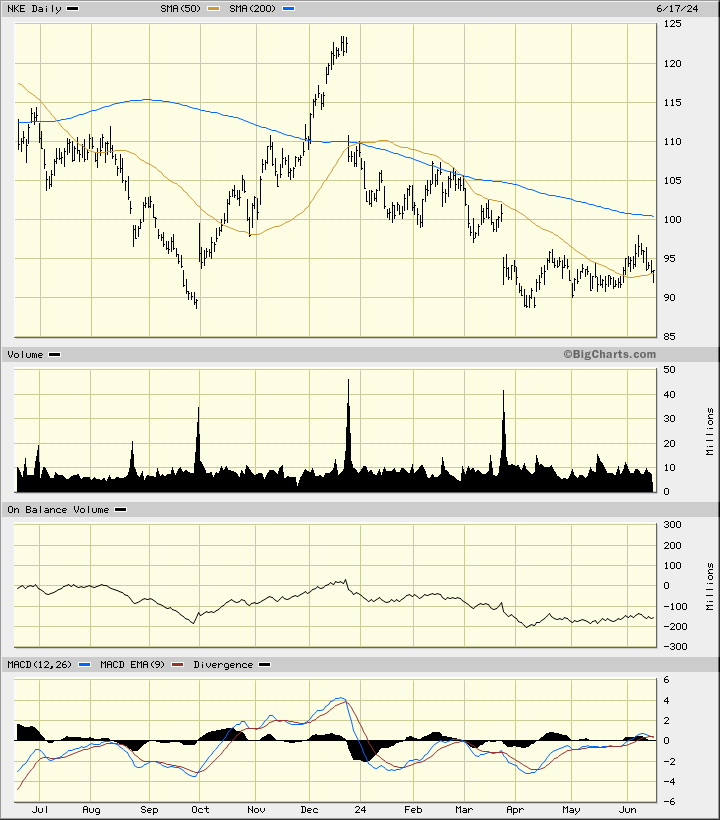
In this daily bar chart of NKE below, I can see it gapped lower after our last review in late March. Prices found some chart support just below $90 and has stabilized. NKE has traded around the 50-day moving average line. The daily On-Balance-Volume (OBV) line has been steady since making a low in early April. The Moving Average Convergence Divergence (MACD) oscillator is slightly above the zero line.
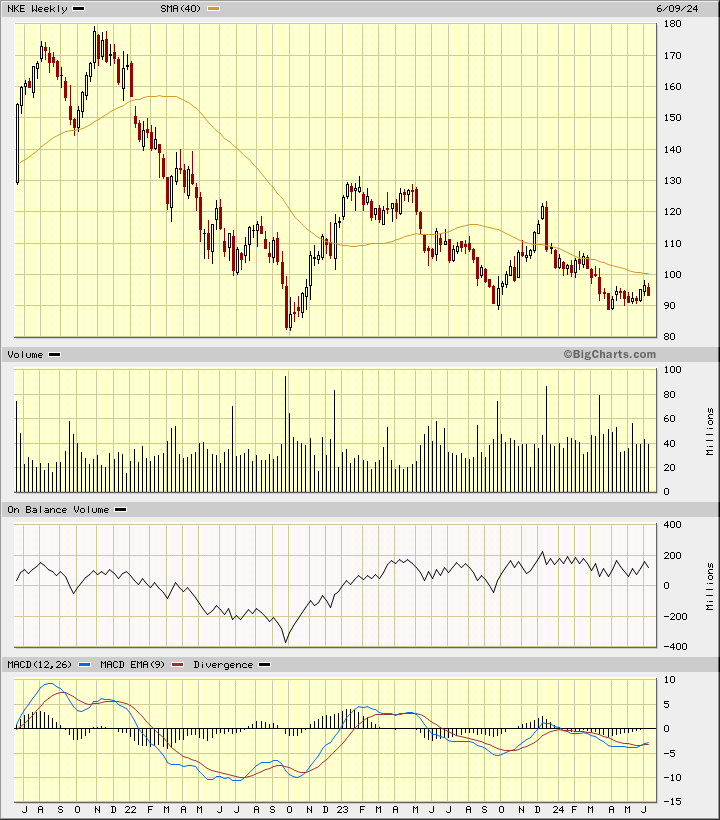
In this weekly Japanese candlestick chart of NKE below, I see a mixed setup. Prices have mostly traded sideways over the past three months. Prices still trade below the declining 40-week moving average line. The weekly OBV line has been steady the past two years. The MACD oscillator is below the zero line but trying to generate a cover-shorts buy signal.
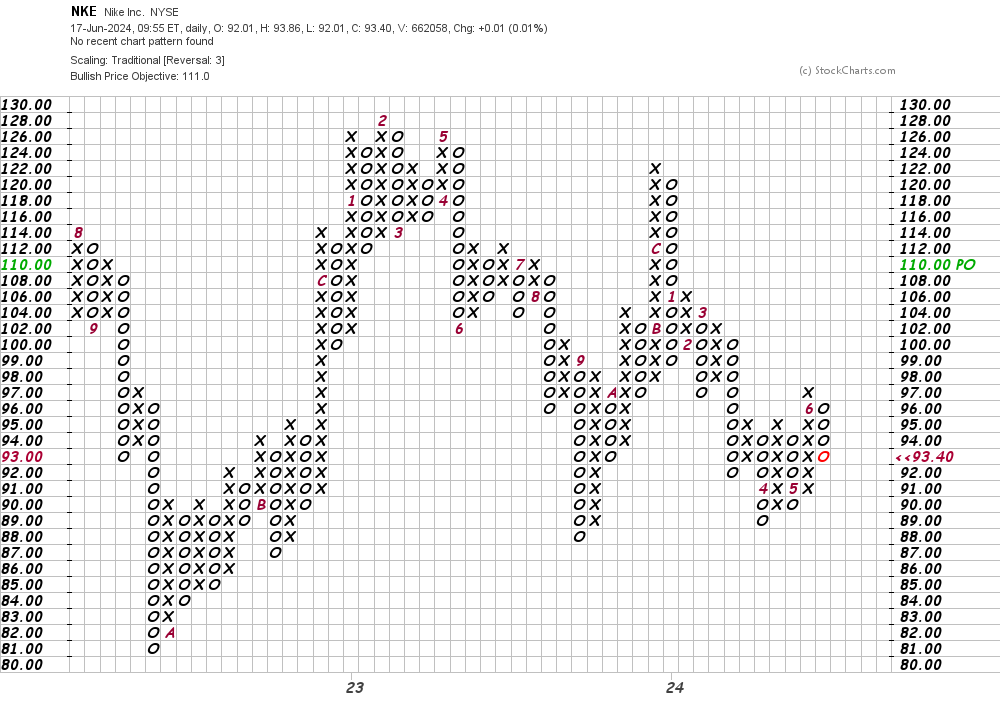
In this daily Point and Figure chart of NKE below, I can see an upside price target in the $111 area.
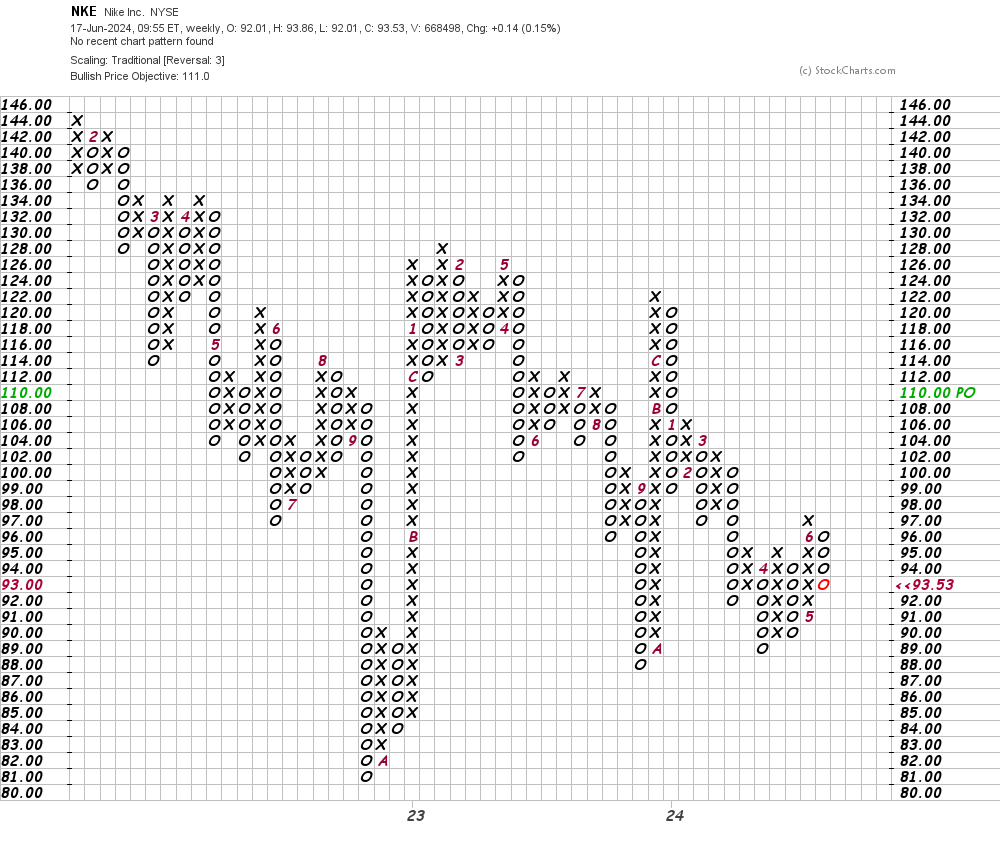
In this second Point and Figure chart of NKE below, I used weekly price data. Here, the software also generated a target in the $111 area.
Bottom line strategy: NKE has been showing us some improvement since early April. Traders who can risk two consecutive closes below $90 could go long.
Employees of TheStreet are prohibited from trading individual securities.