Nike Is Struggling to Find Traction Ahead of Earnings
Let's see what the long side look like.
You've reached your free article limit
You've read 0 of 1 free Pro articles.
Nike, Inc. NKE is scheduled to lace up and report their latest quarterly results after the close of trading Thursday. Let's check out the fit of the charts and indicators ahead of the report to shareholders.
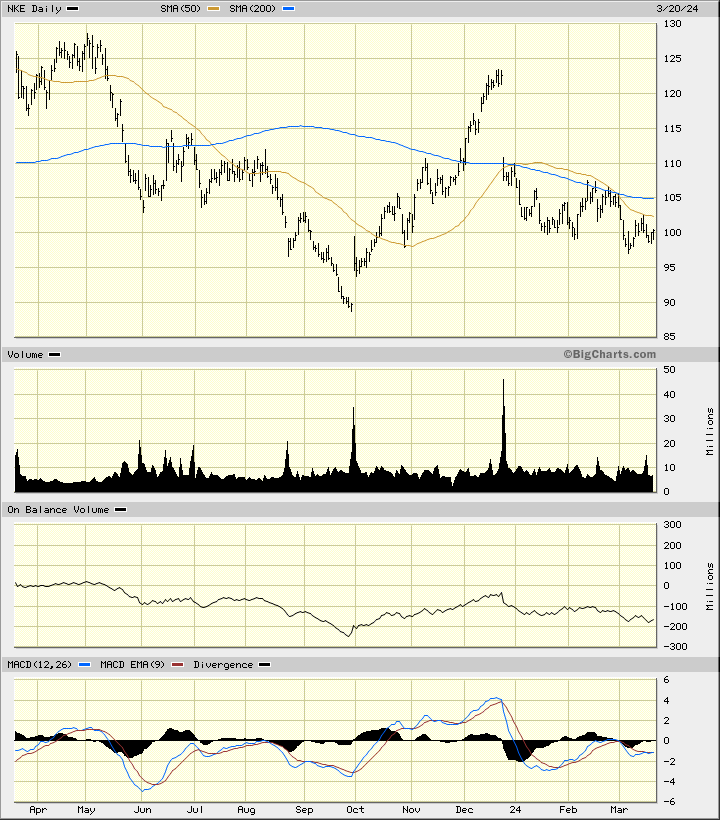
In this daily bar chart of NKE, below, I can see prices have mostly been weak over the past twelve months. NKE gapped lower in late December and has continued lower. NKE trades below the negatively sloped 50-day and 200-day moving average lines.
The On-Balance-Volume (OBV) line has been trending lower since late December telling us that sellers of NKE have been more aggressive than buyers. The Moving Average Convergence Divergence (MACD) oscillator is below the zero line telling us that NKE has little in the way of "trend strength".
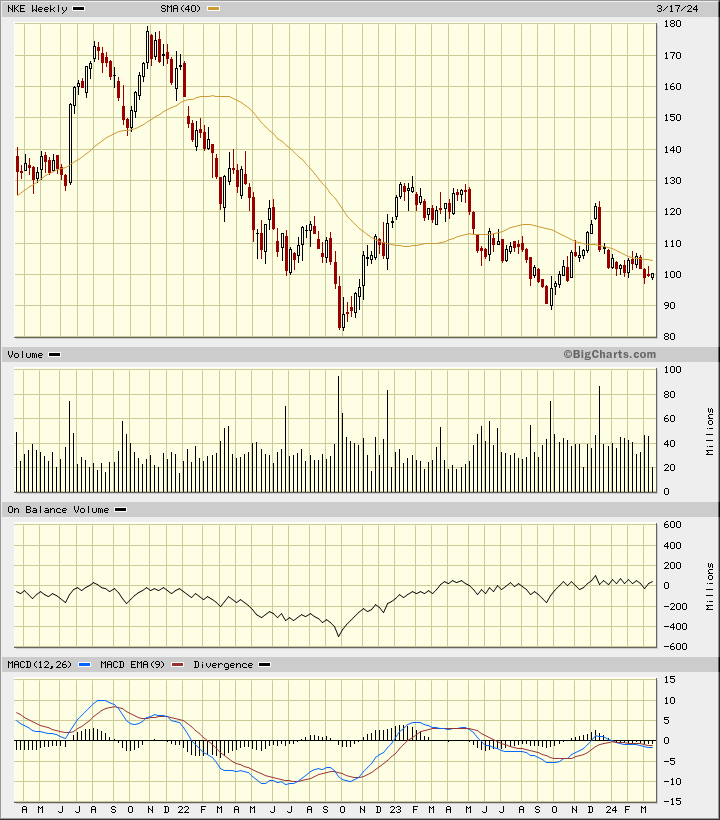
In this weekly Japanese candlestick chart of NKE, below, I can see that NKE has been on the soft side the past three years. NKE trades below the bearish 40-week moving average line. The weekly OBV line has been in a sideways neutral trend for months now. The MACD oscillator is below the zero line.
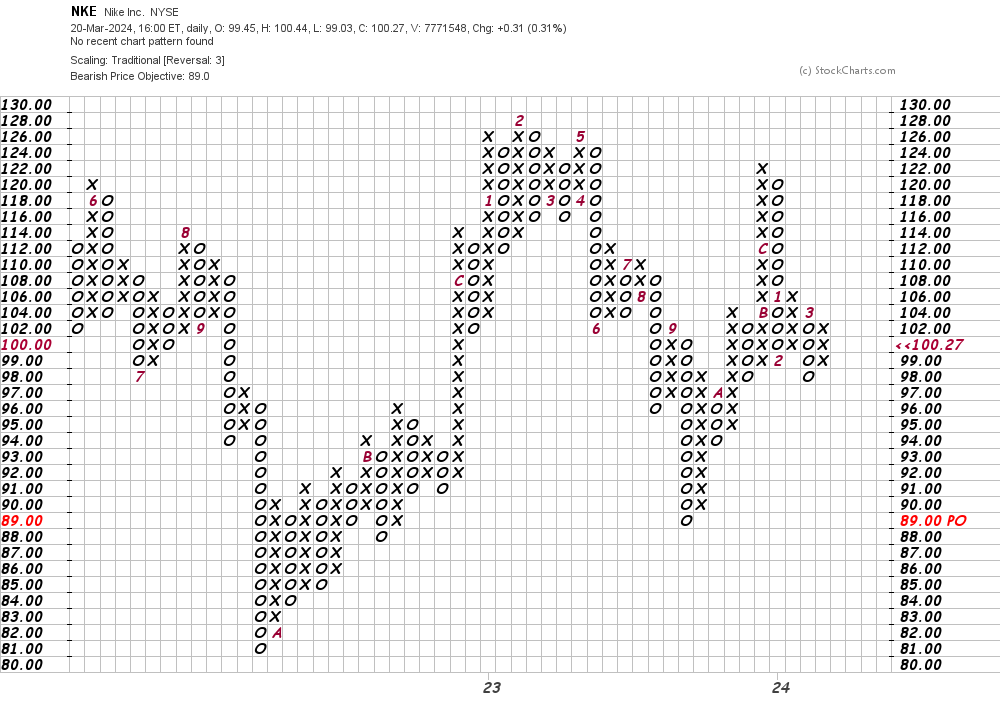
In this daily Point and Figure chart of NKE, below, I can see a potential downside price target in the $89 area.
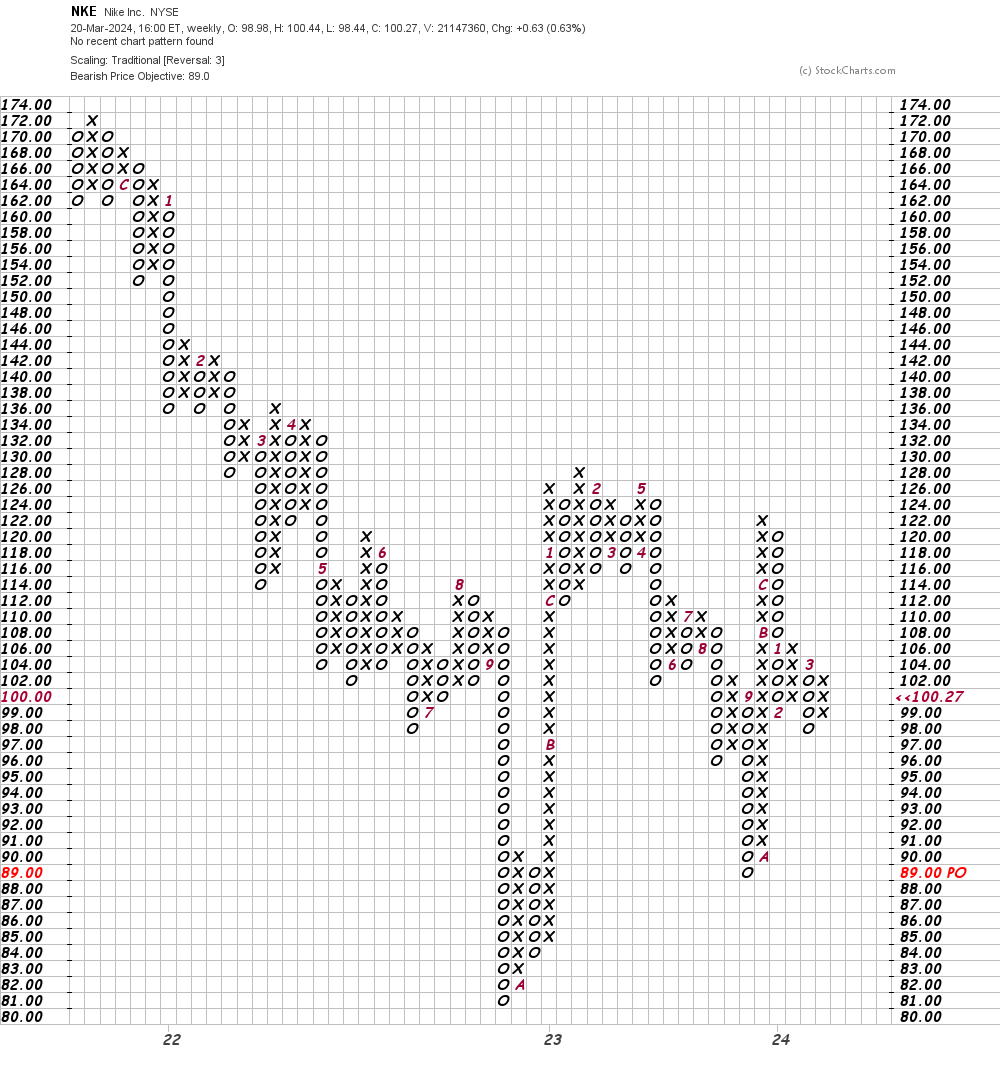
In this weekly Point and Figure chart of NKE, below, I can see the same $89 price target as shown on the daily chart above.
Bottom line strategy: I have no special information about what NKE will tell shareholders this Thursday evening, but the charts and indicators do not give me confidence in the long side. Strength above $106 is needed to improve the chart picture.
Employees of TheStreet are prohibited from trading individual securities.