New Price Targets for AstraZeneca as it Hits Highs
The pharmaceutical giant has racked up big stock price gains and a nice, round number makes our new price target.
You've reached your free article limit
You've read 0 of 1 free Pro articles.
Pharmaceutical giant AstraZeneca AZN has racked up big stock price gains since the middle of February. What could come next? AstraZeneca's main research and development areas include oncology, rare diseases and biopharmaceutical intervention, and it has numerous ongoing projects.
Let's pay a visit to the charts and indicators for an update.
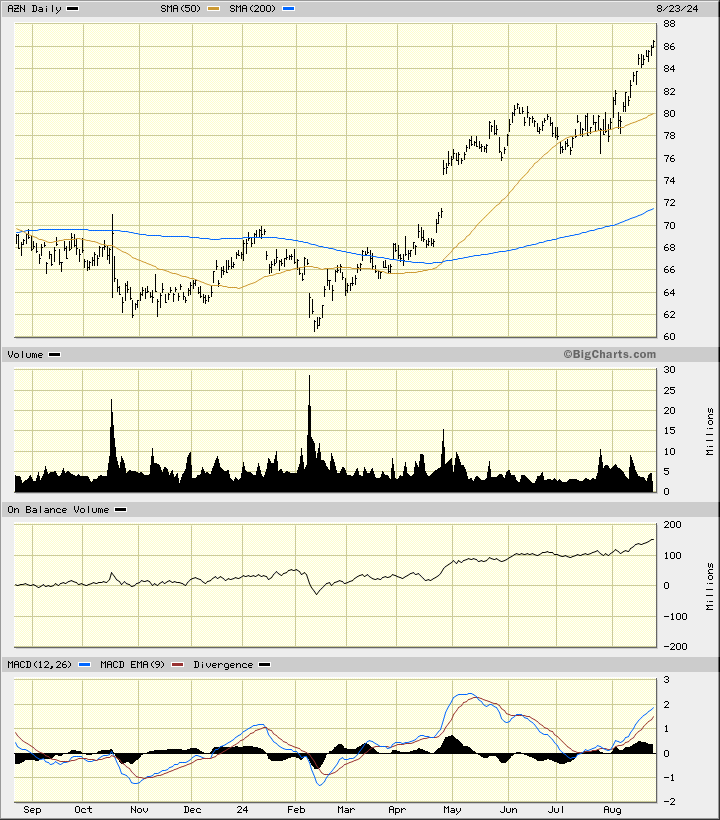
In this daily bar chart of AZN below, I can see that prices have made an impressive rally this year. AZN trades above the rising 50-day moving average line and above the rising 200-day line. The volume histogram shows me three volume surges — at the low in mid-February, in late April on a gap higher and in August. The On-Balance-Volume (OBV) line has moved higher the past 12 months to confirm the price gains. The Moving Average Convergence Divergence (MACD) oscillator is in a bullish alignment above the zero line.
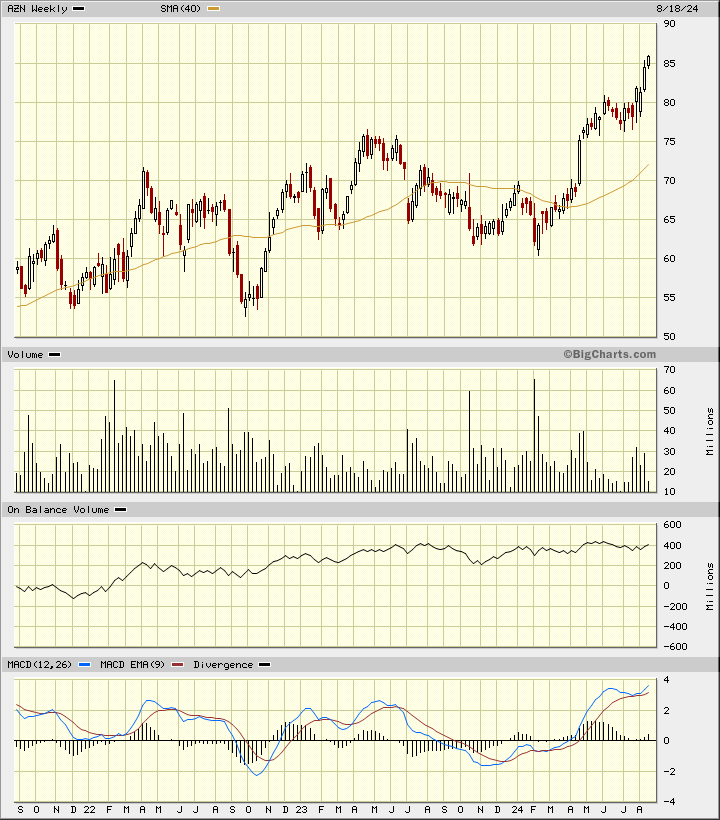
In this weekly Japanese candlestick chart of AZN below, I can see that AZN has been in a bull move the past three years. Prices trade above the rising 40-week moving average line. The weekly OBV line has been in a gentle rise the past three years. The MACD oscillator is in a bullish alignment above the zero line.
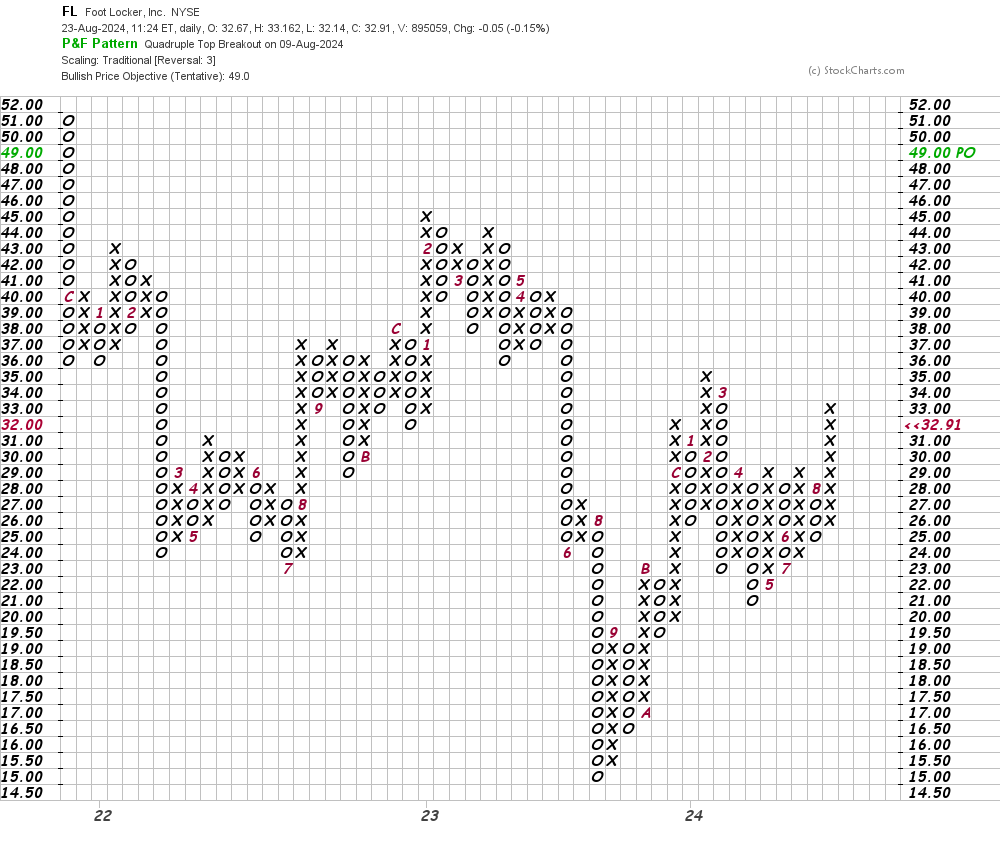
In this daily Point and Figure chart of AZN below, I can see a potential upside price target in the $120 area.
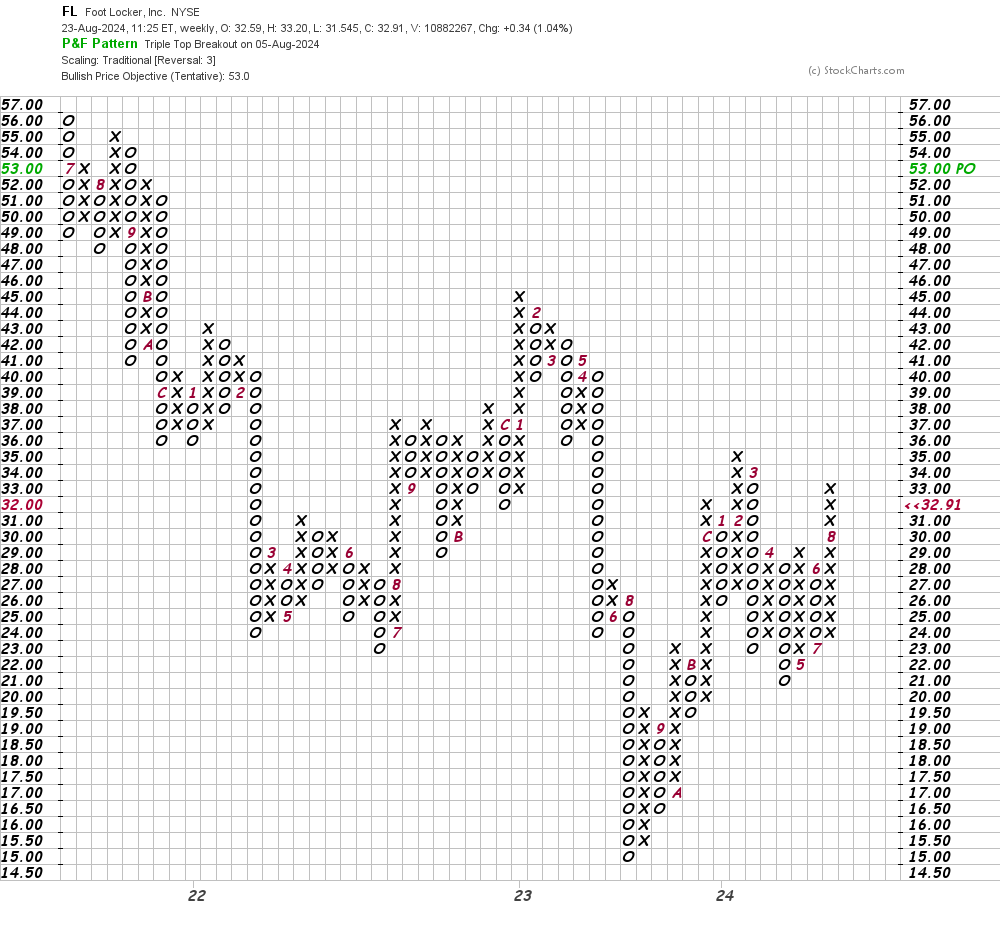
In this weekly Point and Figure chart of AZN below, I can see the $120 area as a price target, just like the daily chart above.
Bottom line strategy: Traders could probe the long side of AZN on a dip to around $84 risking to $80. The round number of $100 is the price target for now.
Employees of TheStreet are prohibited from trading individual securities.