New Price Target for Freeport-McMoRan as Iran Deal Boosts Copper
The mining company has posted an interesting stock chart as precious metals look to rally on the latest update.
You've reached your free article limit
You've read 0 of 1 free Pro articles.

Copper prices improved as negotiations concerning a U.S./Iran peace deal heated up. Gold prices warmed up going into the weekend as the prospects for peace became more realistic. On Friday. President Trump had said that a deal with Iran could be signed within days. By Sunday, there was an actual deal, confirmed by intermediaries such as Pakistan and Qatar, that, if all goes well, will have signatures on it by this Friday.
Gold had traded above $5,300 per ounce as recently as early March and as low as $4,114 per ounce just last week. I saw the yellow metal approaching the $4,400 mark on Monday morning. Copper prices, conversely, sold off early on during the four-month conflict and have rallied inconsistently ever since bottoming in late March.
The beneficiary in all this is Freeport-McMoRan Inc (FCX). That’s a name whose chart has suddenly become very interesting. Let me show you:
Freeport-McMoRan (FCX)
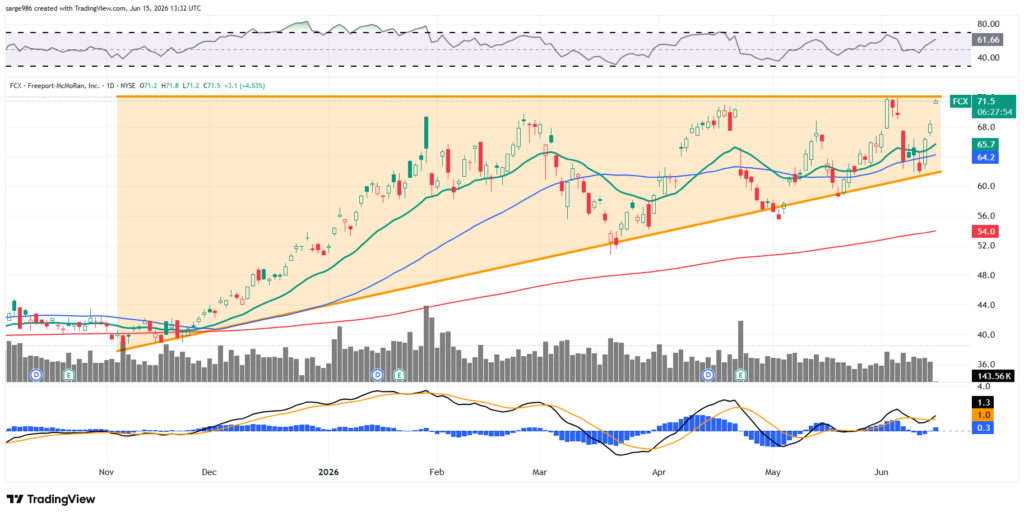
The daily chart of Freeport McMoRan brings about a pattern that we have not seen all that much of in recent markets with all of the war-related, inflation-related and interest-rate-related volatility. I speak of the ascending triangle pattern, which is a bullish setup. The ascending triangle is a close cousin of the rising-wedge pattern. Both are patterns that sport consistent higher lows.
The difference would be that rising-wedge patterns also sport higher highs until the music stops as that setup is a pattern of bearish reversal. The ascending triangle has a different series of tops and is considered to be a pattern of bullish continuation. The pivot here would be the June 2 $72.09 top. The stock is trying to take and hold that pivot point on Monday morning.
Moving on to the indicators, relative strength (above the chart) is better than neutral, but not technically overbought and improving. Additionally, the daily MACD is looking a bit more bullish. The histogram of the nine-day EMA has moved into positive territory while the 12-day EMA has moved above the 26-day EMA. These are both short- to medium-term bullish signals.
I am not long this stock at this moment. I am interested in initiating the name on a take and hold of the $72.09 level.
Target Price: $87
Pivot: $72.09
Panic: If already long, on loss of the 50-day SMA (currently $64.20)
At the time of publication, Guilfoyle had no positions in any securities mentioned.
