New Price Target for Apple After Record Breakout
New price targets for Apple, Home Depot and Coinbase stocks as we enter one of the most bullish months of the year.
You've reached your free article limit
You've read 0 of 1 free Pro articles.
It’s that time of the year. Friends and family, holiday cheer and football in the snow.
And leftovers. Not everyone likes leftovers, but I love them. The fact that there are significant amounts of turkey, stuffing and cranberry sauce in my fridge right now brings joy to my heart.
It’s also a great month to own stocks. According to Jeffrey A. Hirsch, publisher of the "Stock Trader’s Almanac," the S&P 500 has averaged a 1.5% gain in the month of December since 1950.
Now is a good time for a portfolio of leftovers — stocks that you may have owned in the past. They might taste even better the second time around.
We’ll start with the main course, add a side dish, and then dessert.
Main Course: Apple (AAPL)
What could better than Apple AAPL — arguably the most important U.S. stock, due to its $3.625 trillion market cap — breaking out to new highs? How about Apple breaking out to new highs on the first trading day of one of the most bullish months of the year?
Apple formed an ascending triangle pattern (black dotted lines) over the past five months. In July and October, Apple failed to break above $237 (red arrows). On Monday, the third time was the charm, as Apple closed at an all-time high of $239.
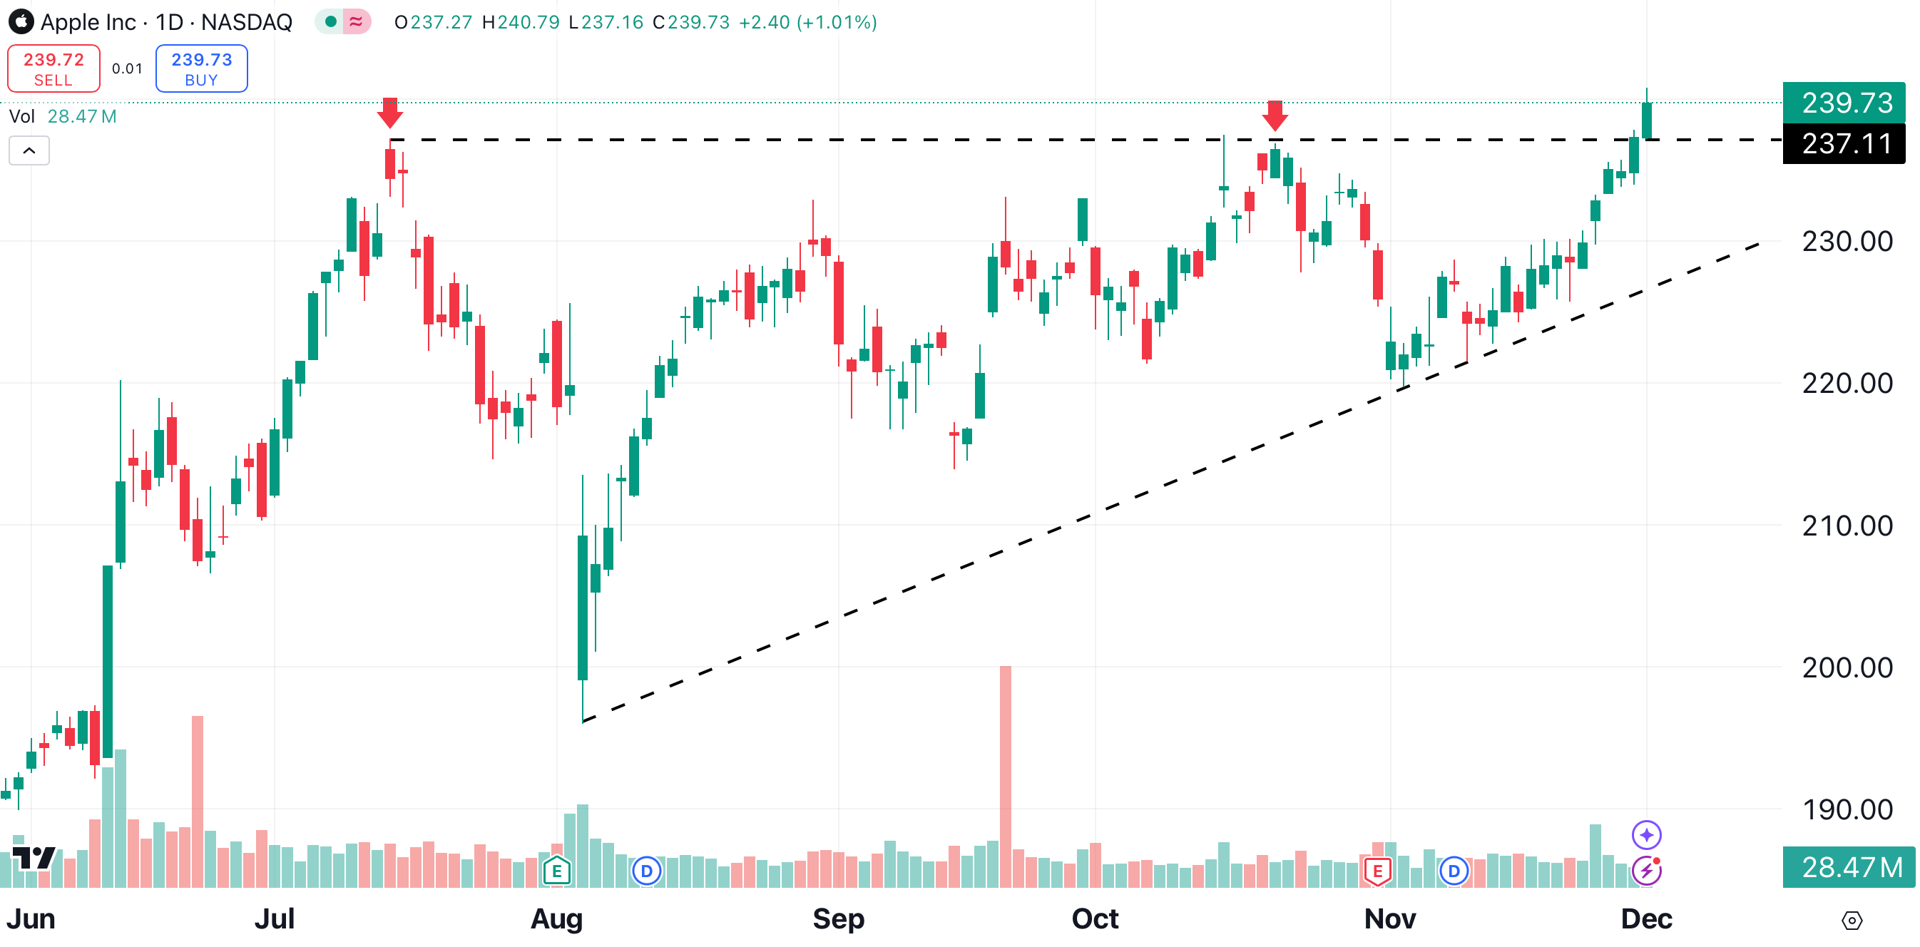
What’s next for Apple? With earnings in the rearview mirror, and no technical obstacles ahead, the path of least resistance is higher. By applying an old-school measuring technique to the bullish triangle, we determine Apple's price target to be $275.
2. Side Dish: Home Depot (HD)
The housing market may be quiet, but Home Depot HD is making some noise.
Better loosen your belt for this one, because Home Depot’s bullish pattern is too large to fit on a standard daily chart. Instead, let’s zoom out to a monthly chart.
Home Depot has formed a massive rounded bottom continuation pattern. Shares of the home improvement retailer have been consolidating for the past two years, and are finally breaking out.
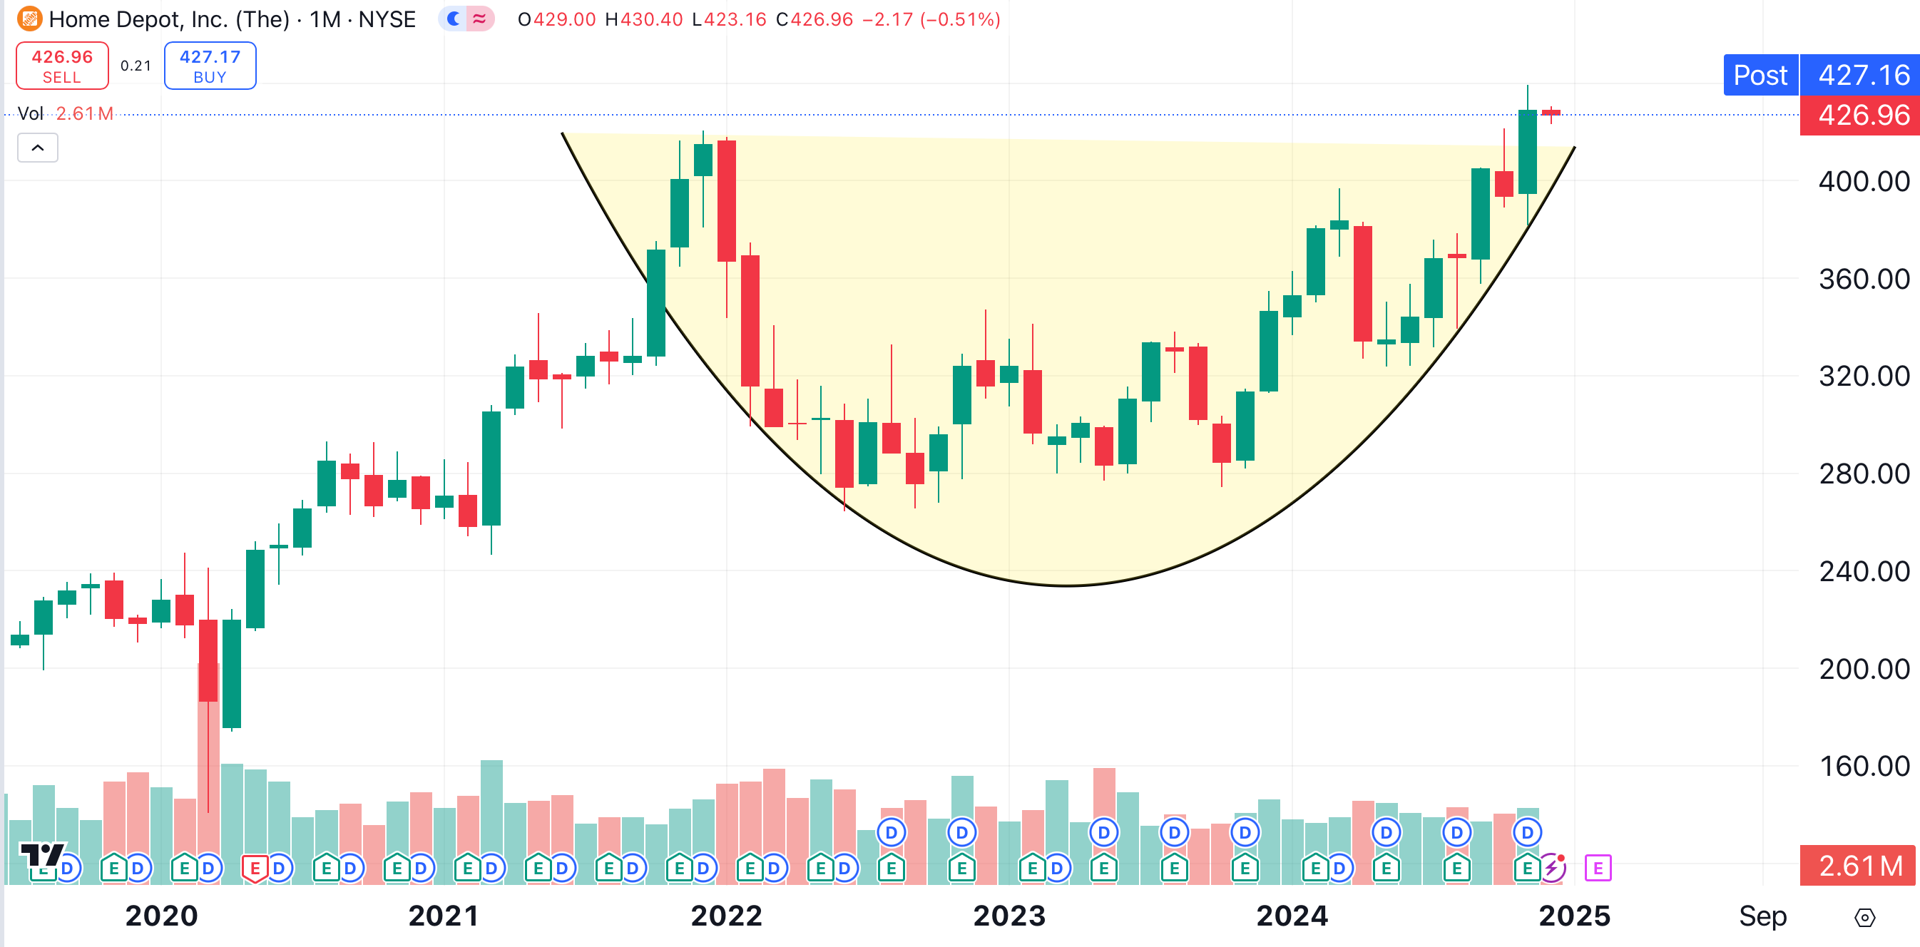
On Monday, Home Depot closed just $2 below its all-time closing high of $429, set just last week. The stock has split a total of 13 times, most recently in December of 1999. Based on the size of this pattern, shares of Home Depot could reach $550.
3. Dessert: Coinbase Global (COIN)
Coinbase COIN went public on April 14, 2021. If we view the entire history of Coinbase as a publicly-traded stock, a large inverse head and shoulders pattern (shaded yellow) is visible on the weekly chart.
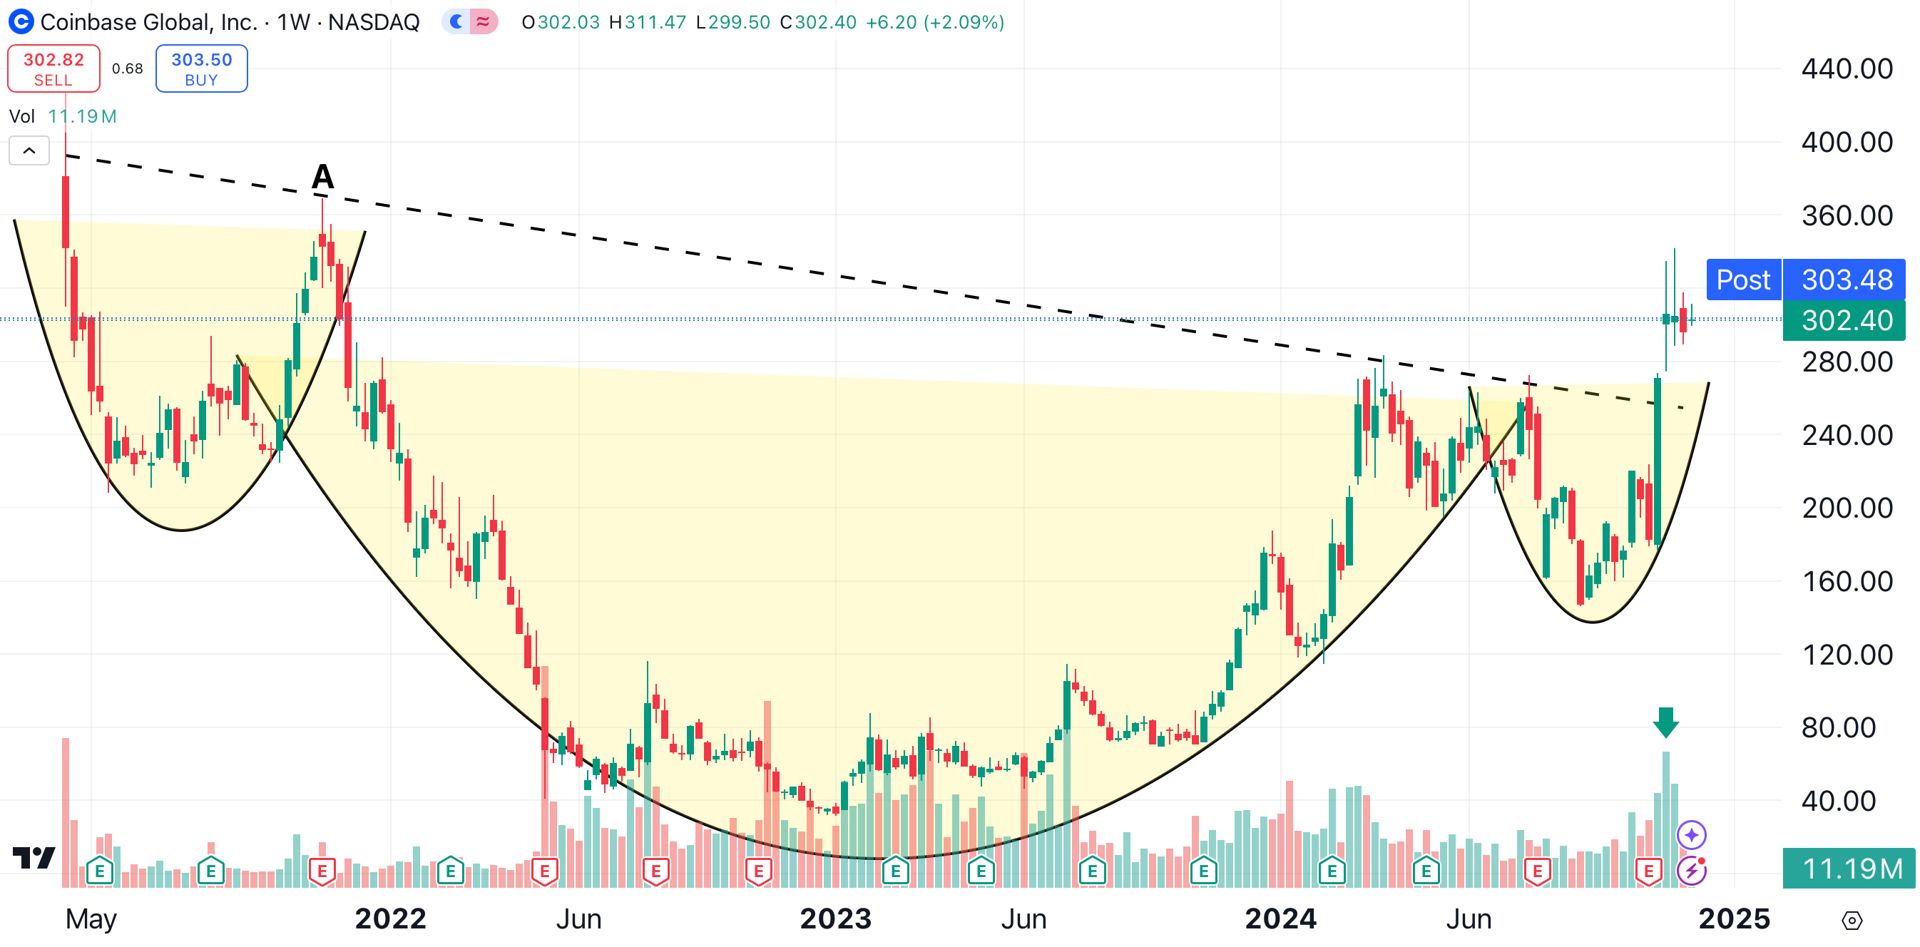
Coinbase broke out of this pattern on heavy volume (arrow), a bullish signal.
Because the pattern includes the stock’s entire trading history, traditional methods for obtaining a target aren't useful. Instead, a rally to the stock’s next resistance level (point A) generates a reasonable price target of $386.
At the time of publication, Ponsi was long AAPL, HD and COIN.