Micron Technology Has Resistance Ahead
This technology stock could fail at the 200-day line, and here's what that means for investors.
You've reached your free article limit
You've read 0 of 1 free Pro articles.
Micron Technology's MU stock is up around 2.5% on Tuesday, but the company, according to Citicorp has an inventory problem, with both personal computers and wireless supply chains.
Let's review the charts and indicators for some guidance.
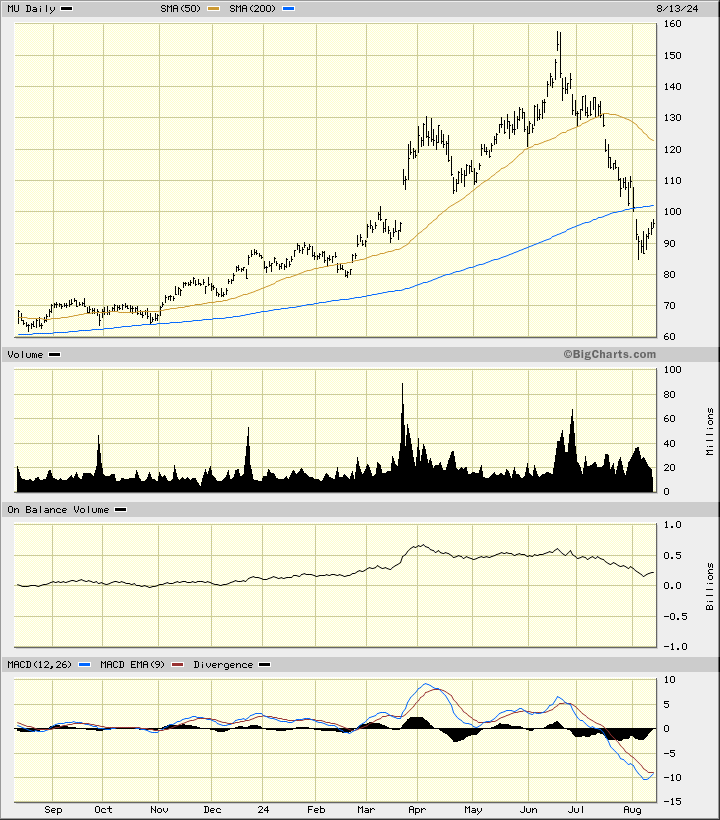
In this daily bar chart of MU, below, I can see that prices declined from late June and fell beneath the 50-day moving average line and the 200-day moving average line. Prices have been bouncing back in recent days, but they should encounter resistance at the underside of the 200-day moving average line.
The On-Balance-Volume (OBV) line started to weaken in early April showing that the OBV line can be a leading indicator. The Moving Average Convergence Divergence (MACD) oscillator is well below the zero-line in sell territory.
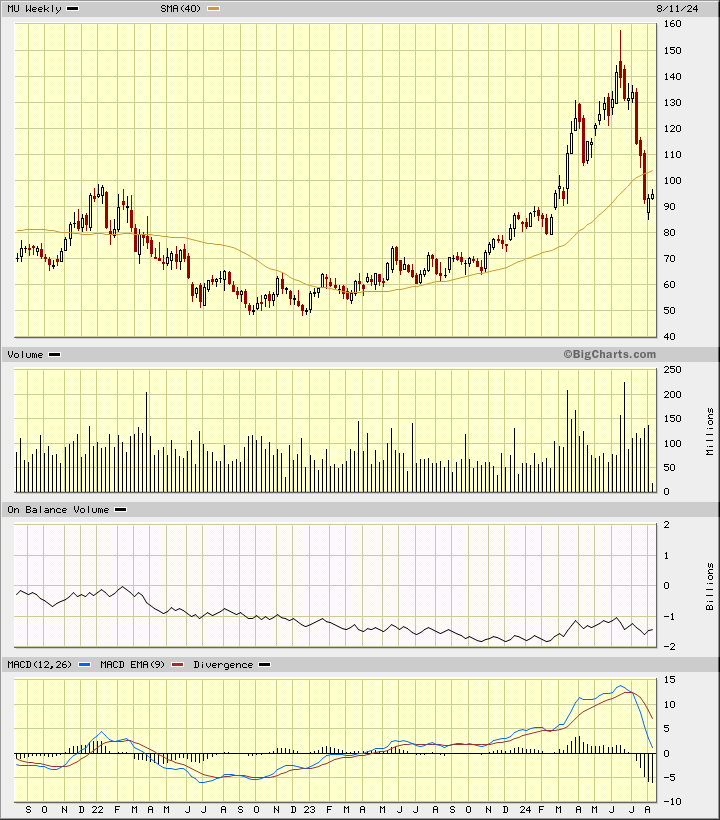
In this weekly Japanese candlestick chart of MU, below, I can see that prices made a deep decline in about two months, but it does not look like the selloff is over. Prices trade below the cresting 40-week moving average line. The weekly OBV line has weakened since early June. The MACD oscillator has crossed to the downside for a take-profits sell signal.
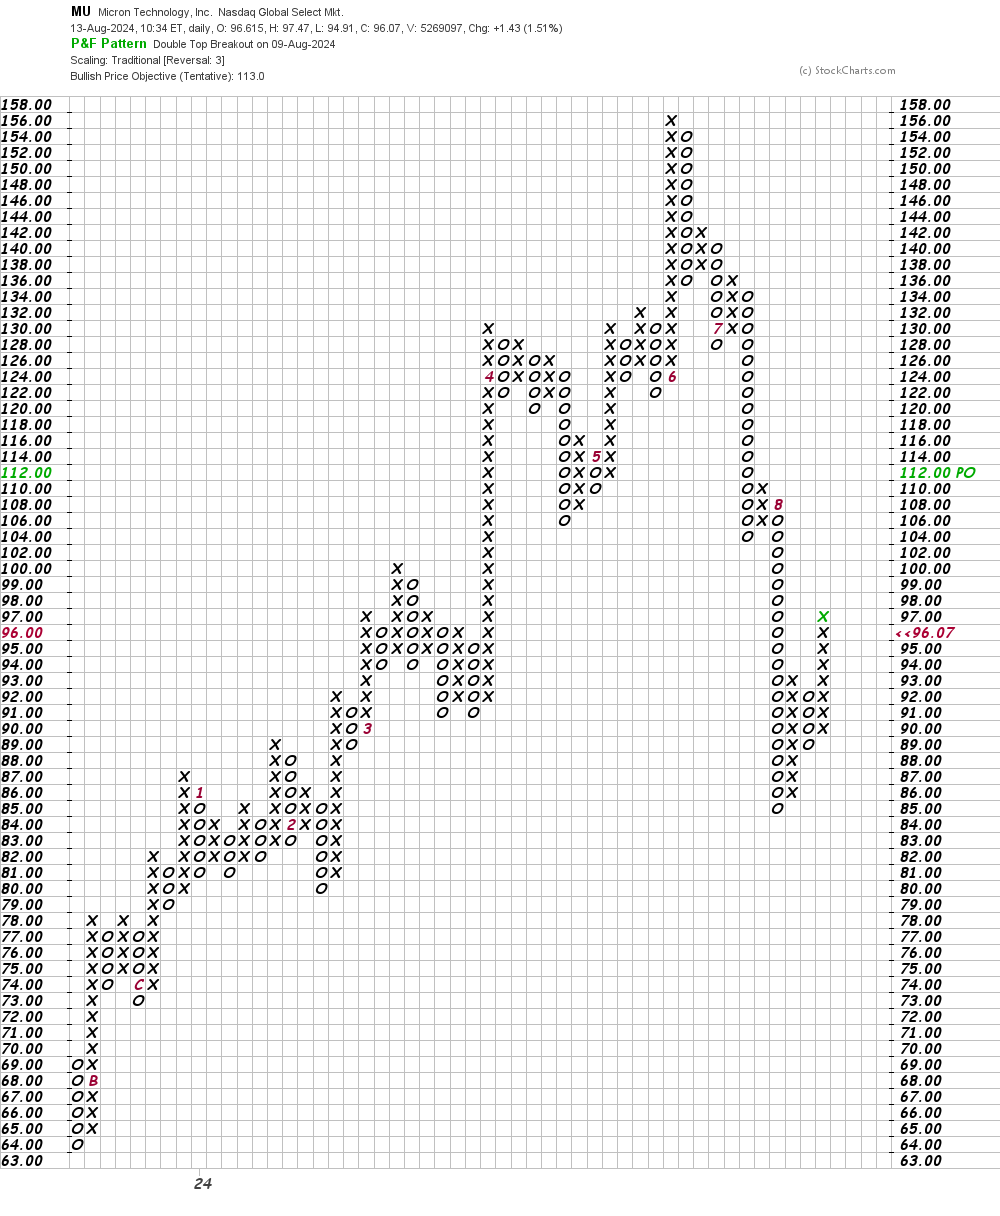
In this daily Point and Figure chart of MU, below, I can see an upside price target in the $113 area. The $113 area is roughly the underside of the 200-day moving average line. Technically oriented traders may become sells at this chart point.
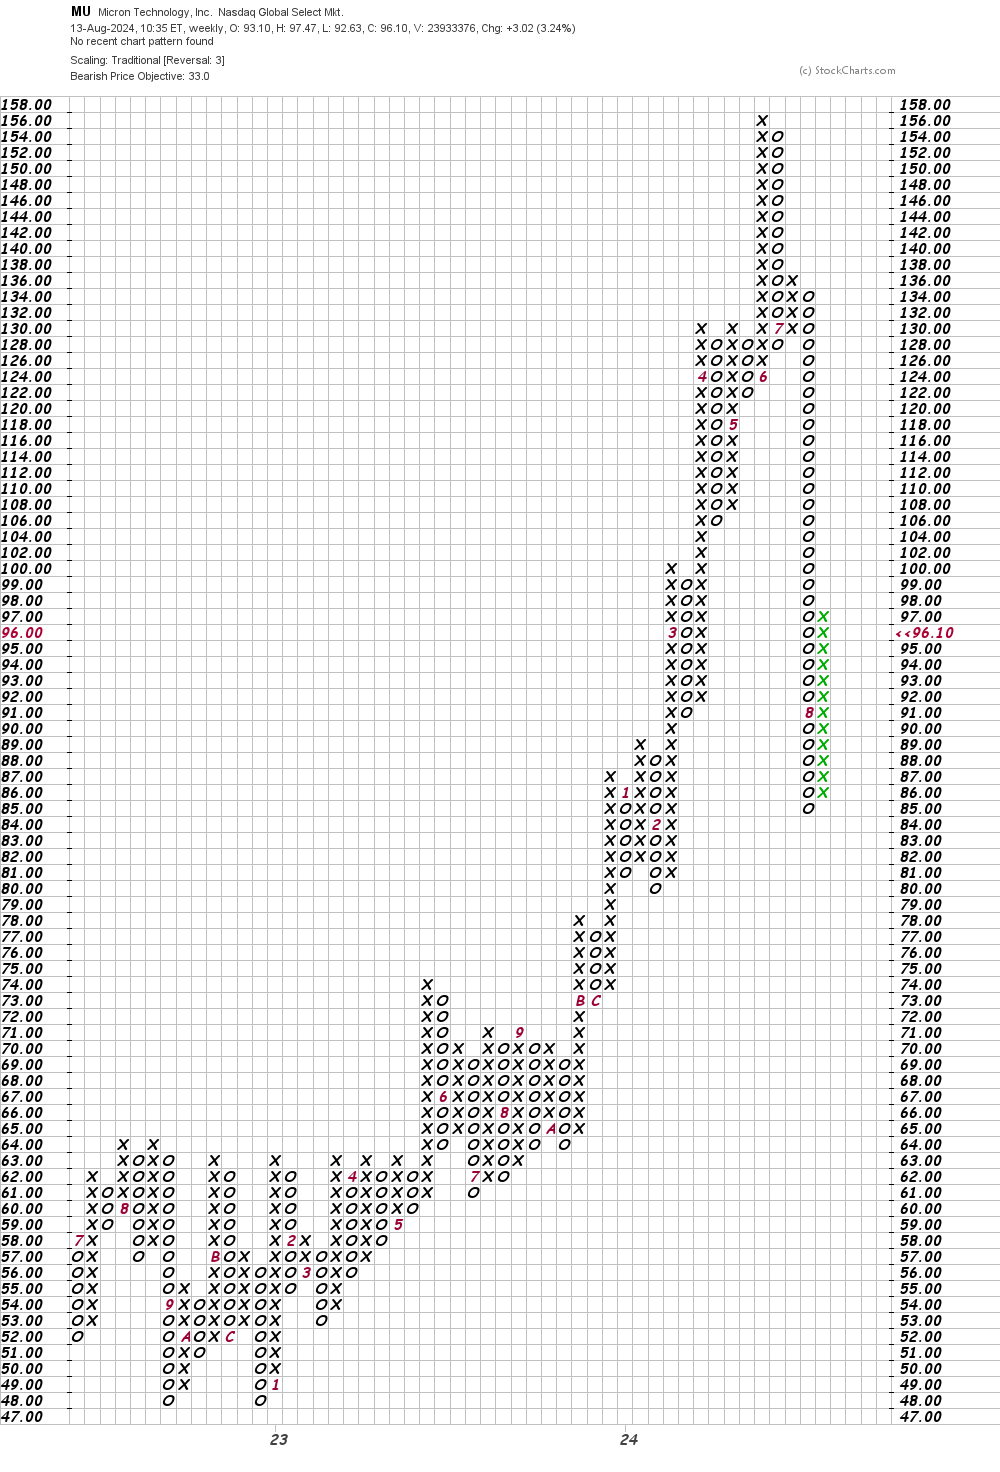
In this weekly Point and Figure chart of MU, below, I can see that the software is suggesting a downside price target in the $33 area.
Bottom line strategy: Sometimes the 200-day moving average acts as support and sometimes it acts as resistance. I am looking for the 200-day line to act as resistance on MU in the days ahead.
Employees of TheStreet are prohibited from trading individual securities.