Meta Stock Is Looking Toppy: Outright Sell Signal Could Be Coming Soon
Are you in this 'crowded trade'? Here's what to do.
You've reached your free article limit
You've read 0 of 1 free Pro articles.
It has been reported that Barclays has cut their estimates for Amazon AMZN, Meta META and Alphabet GOOGL on "odd depreciation expense issues," saying that Wall Street has incorrectly modeled this "not-so-hidden cost of AI."
Another firm has called the Magnificent Seven the most crowded trade and META is a part of that group.
Let's check the charts and indicators to see how these observations by fundamental analysts are playing out.
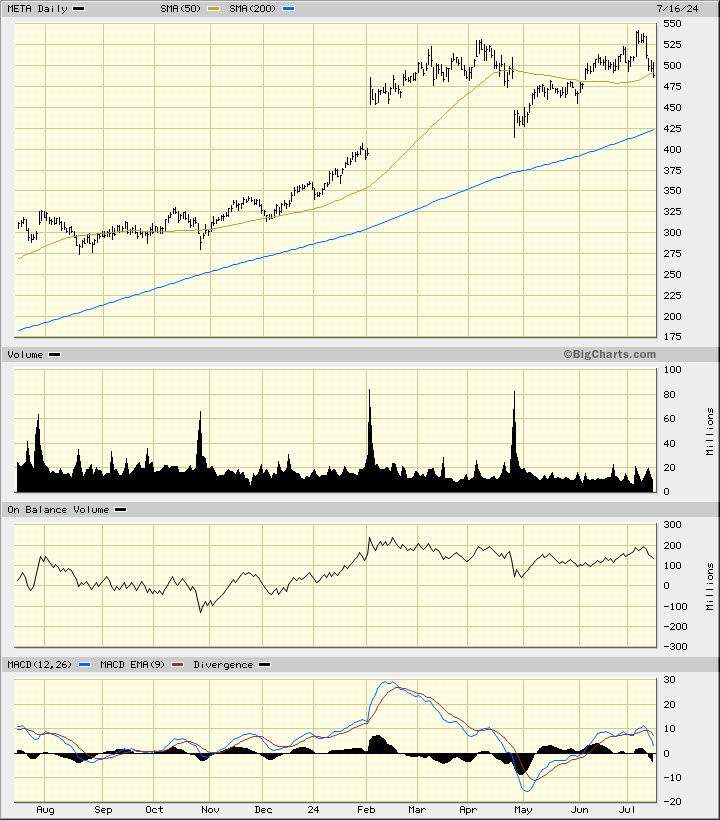
In the daily bar chart of META, below, I can see that the shares have made what could become a lopsided double-top formation. Prices made a high in April and a slightly higher high in July. A break below the April low will complete the top formation. The shares trade above the rising 200-day moving average line but they are now testing the cresting 50-day moving average line.
The On-Balance-Volume (OBV) line has been slowly weakening since posting a high back in February. A declining OBV line happens when trading volume on down days is greater than the volume on up days.
The Moving Average Convergence Divergence (MACD) oscillator made a peak back in February and has declined ever since. This trend-following indicator is only slightly above the zero line. An outright sell signal could be coming soon.
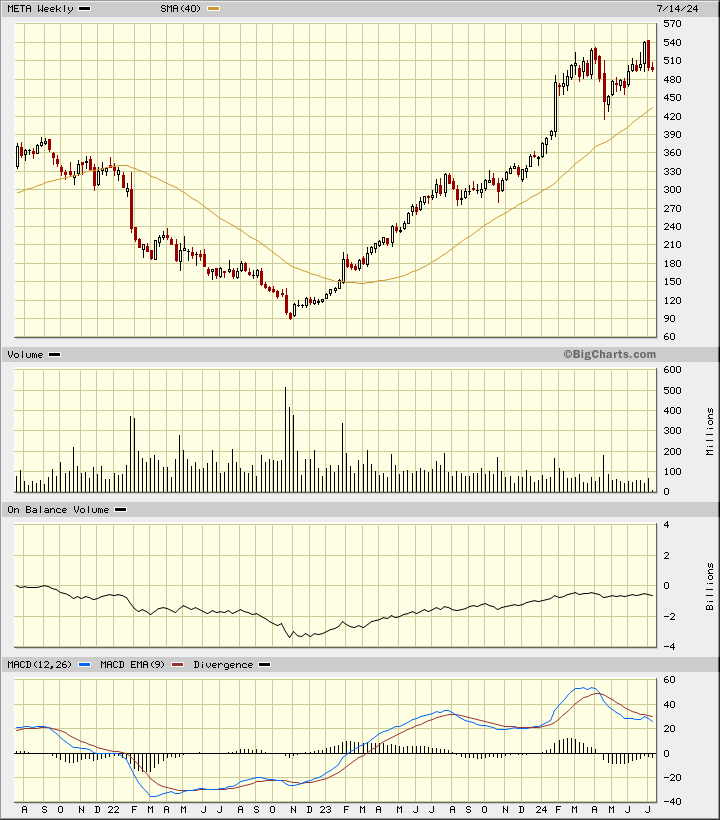
In the weekly Japanese candlestick chart of META, below, you get a better view of the "double top" pattern. This pattern is a top reversal and prices have made a huge rally and thus have something to reverse. META trades above the rising 40-week moving average line but this is a lagging indicator.
The weekly volume histogram shows that trading volume has been declining for some time now. The weekly OBV line stopped its advance back in March. The MACD oscillator is pointed down and crossed to the downside in April.
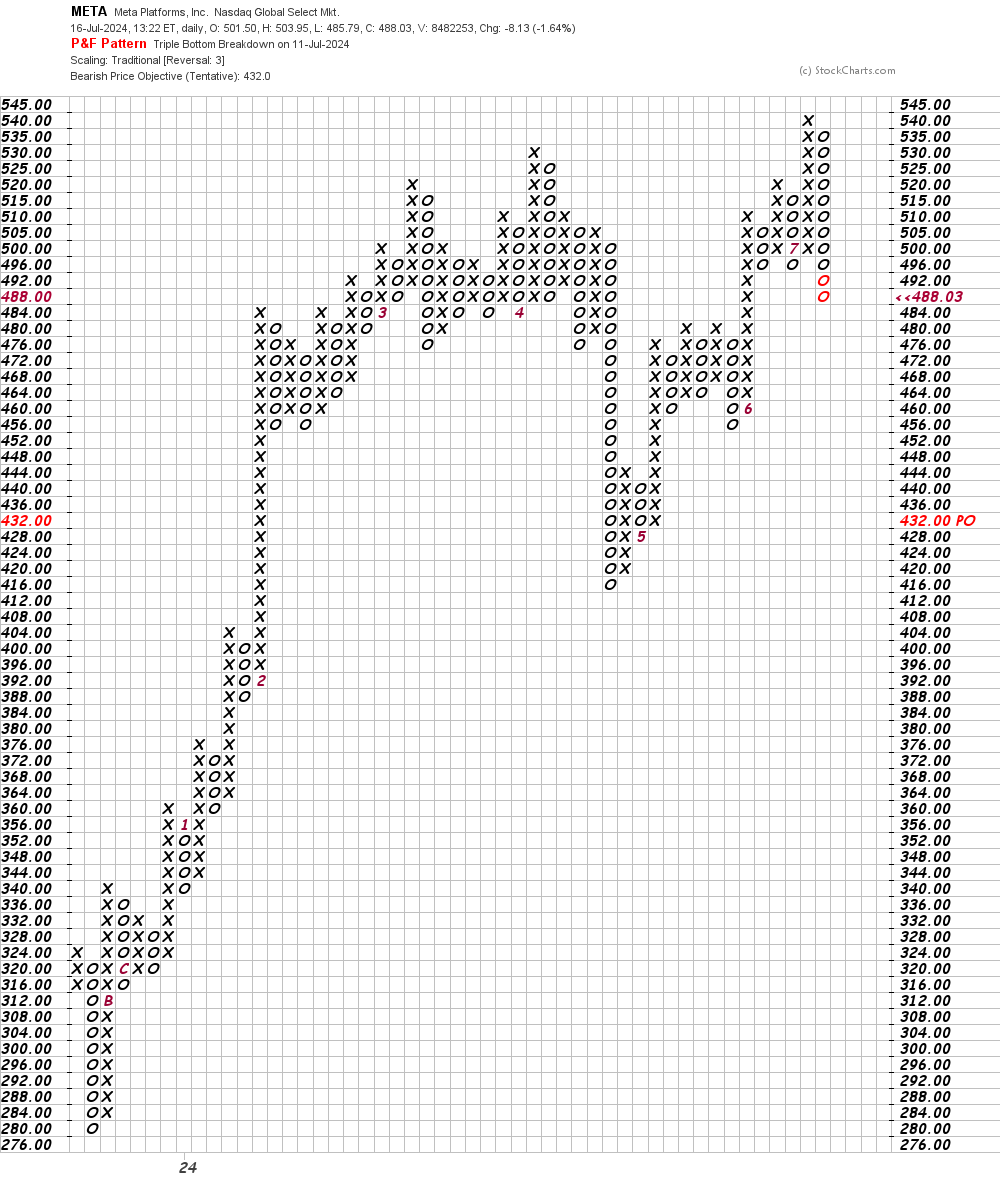
In this daily Point and Figure chart of META, below, I can see that the software is projecting a potential downside price target in the $432 area.
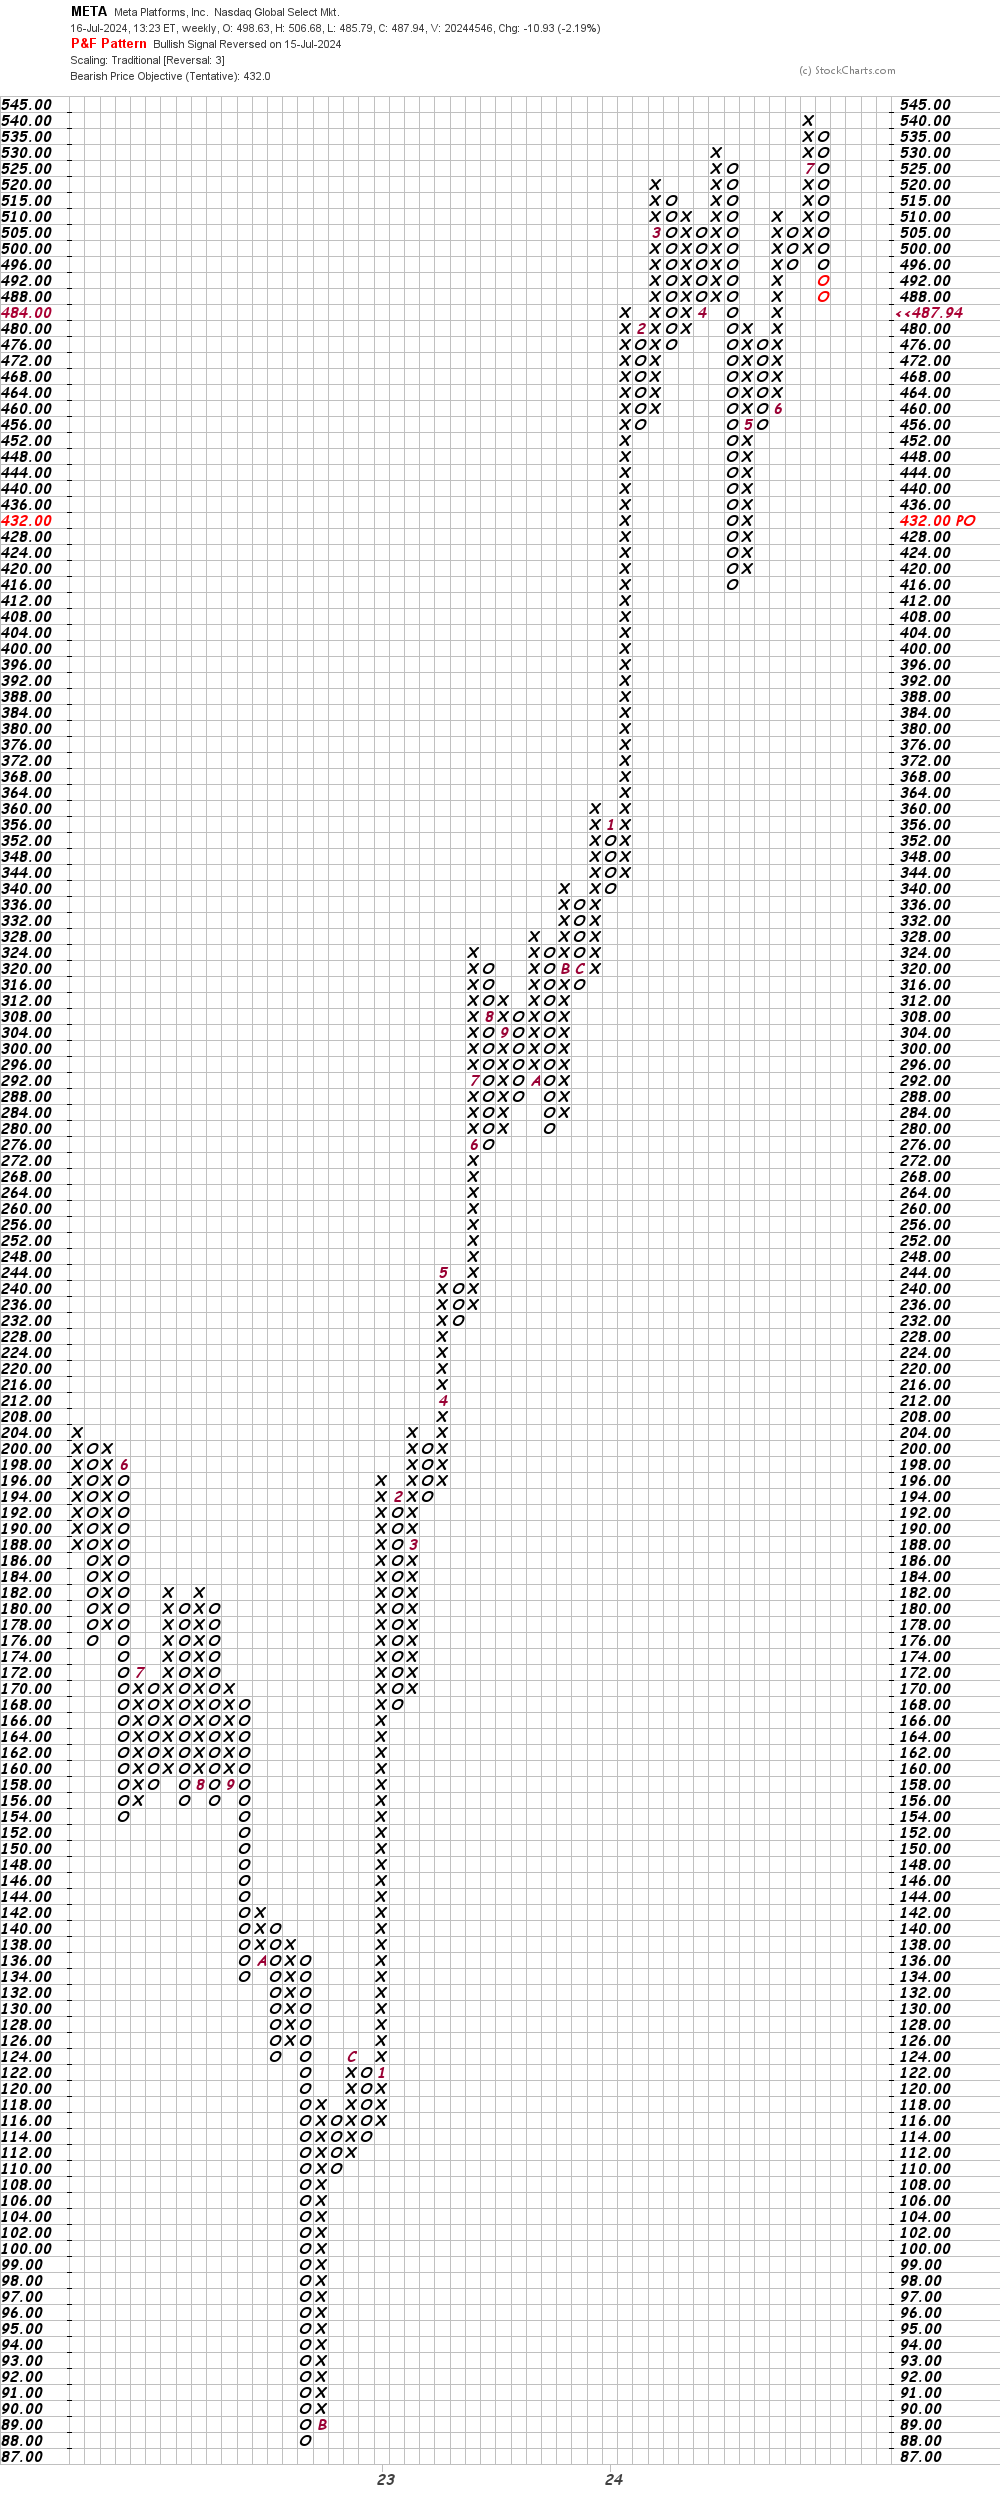
In this weekly Point and Figure chart of META, below, I can see a price target in the $432 area like the daily chart above. A trade at $412 could precipitate further declines.
Bottom-line strategy: Is this another Chicken Little story where the technical analyst says "sell" and the stock climbs to new highs? I don't think so. Traders who are long META should consider raising their stop protection or reducing their exposure.
Employees of TheStreet are prohibited from trading individual securities.