VIX Warned of SOX Fall. What’s Next?
The data and statistics say we should see more corrective action, but we also got one or two extremes from Friday’s action.
You've reached your free article limit
You've read 0 of 1 free Pro articles.

The Market
When the VIX is up six points on the day, and the SOX falls by ten percent, I would say the DSI for the VIX at 10 mattered. But what comes next?
That, as you can imagine, is the hard part. You see, the data and statistics say we should see more corrective action, but we also got one or two extremes from Friday’s action.
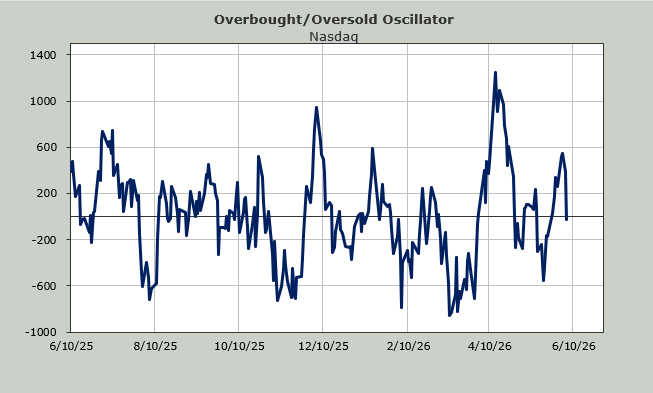
First of all, despite the massive decline in so many of the winners, we are still not oversold. My own Overbought/Oversold Oscillator, which got overbought midweek last week, is based on the ten-day moving average of the advance/decline line and says we have about another week before we get to some sort of oversold level. Notice that this Nasdaq Oscillator is only just now at the zero line.
When I do some what-ifs on the Nasdaq Momentum Indicator, it still shows we are about a week away from an oversold condition there. Those are obviously based on not just breadth but time, although the Nasdaq Momentum Indicator is based on price and time. So I turn to the what-ifs for the McClellan Summation Index. Here, I look for an extreme reading.
What will it take to get the Summation Index to stop its decline and turn upward? Currently, the NYSE needs a net differential of +1200 advancers minus decliners to do that. An oversold reading would be at +3000 or greater (over +4000, and we are very oversold). Thus, that number is more neutral than oversold.
For now, I will leave a discussion on the intermediate-term indicators for another time since they reached an overbought condition about three weeks ago and are not yet oversold. Of note, Friday’s whack took Nasdaq and the S&P right back to the levels we saw in early May, almost as if the market was forced to give back its gains because it should not have had that last extension upward.
The moving averages of the put/call ratios are still very low, so they say there should be more downside because the market needs more fear in it. But Friday’s reading of .97 was the highest since early April. That tells me market participants got a bit anxious on Friday (that’s good news because fear brings panic and panic brings buying opportunities).
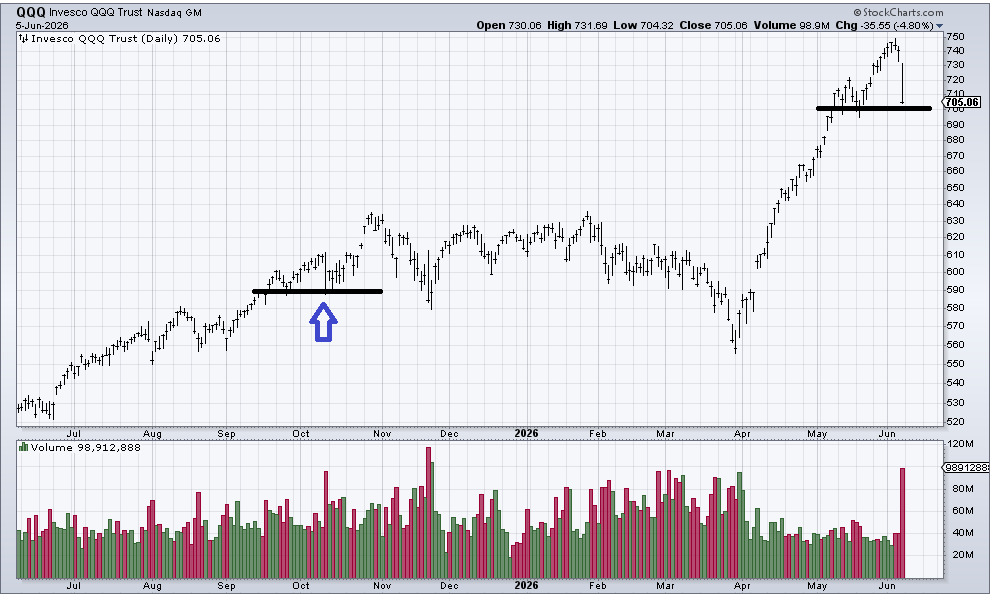
Then there is the volume in the QQQs. It came just shy of 100 million shares; that is the highest since the November low and tends to be panicky. On the chart, I have put a blue arrow in early October because you can see how different that whack looks than the November one.
The November high volume arrived after the QQQs had already been down close to ten percent, thus the market had been given the time needed to get properly oversold. The early October low came right off a high, similar to this time.
Let’s not focus on the rally off the October low as much as stepping back and noting that that entire period of time (call it October/November) was a period of chop/correction. So if we do get a rally on Monday, I still think the market is in a correction mode.
I want to finish by pointing out, if the market cannot rally on Monday, that would be a big change in character for the market.
New Ideas
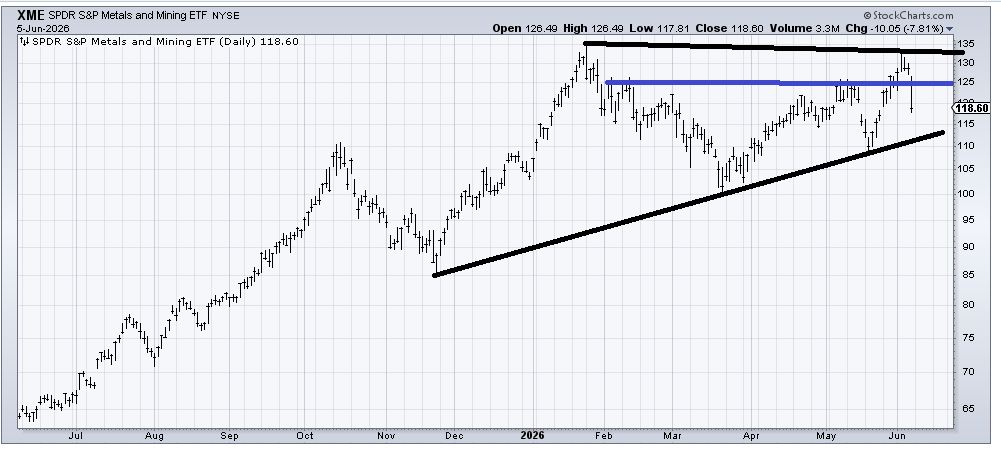
I need to address XME because I was fairly certain that blue line at 125 would hold and be a place it was buyable, and it sliced through there like a hot knife through butter. I do think that lower line holds, but for the time being, I must take a wait-and-see position.
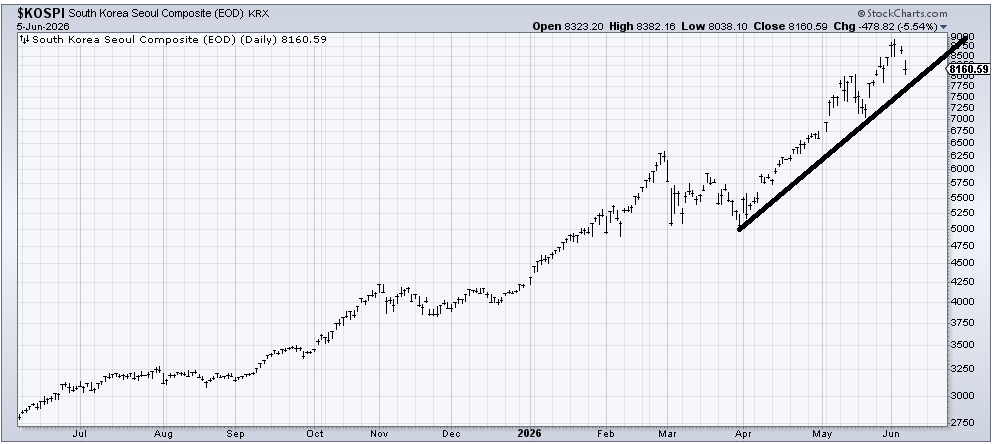
If you are looking for clues for Monday’s action, then you will want to watch how the Korean Kospi trades overnight on Sunday. That uptrend line (comes in around 7700) will have all eyes on it. What I will focus on is not just the line but that 7000 area because for the Kospi, that is the equivalent of where Nasdaq and the S&P fell to Friday: that mid-May low. If the Kospi can’t break the line, I believe there will be relief all around.
Today’s Indicator
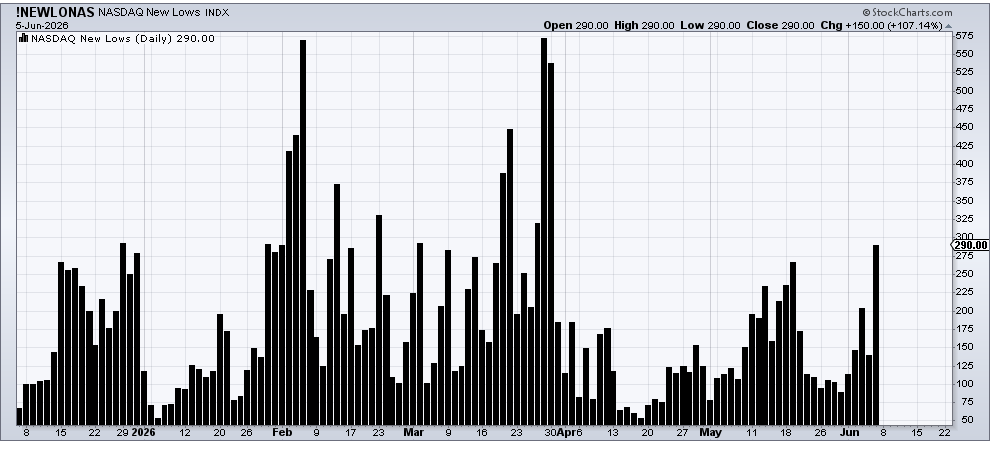
The NYSE did not see an increase in new lows, but Nasdaq got close to 300 new lows. If you are bullish, you want that to contract in a hurry.
Q&A/Reader’s Feedback
Helene welcomes your questions about Top Stocks and her charting strategy and techniques. Please send an email directly to Helene with your questions. However, please remember that TheStreet.com Top Stocks is not intended to provide personalized investment advice. Email Helene here.
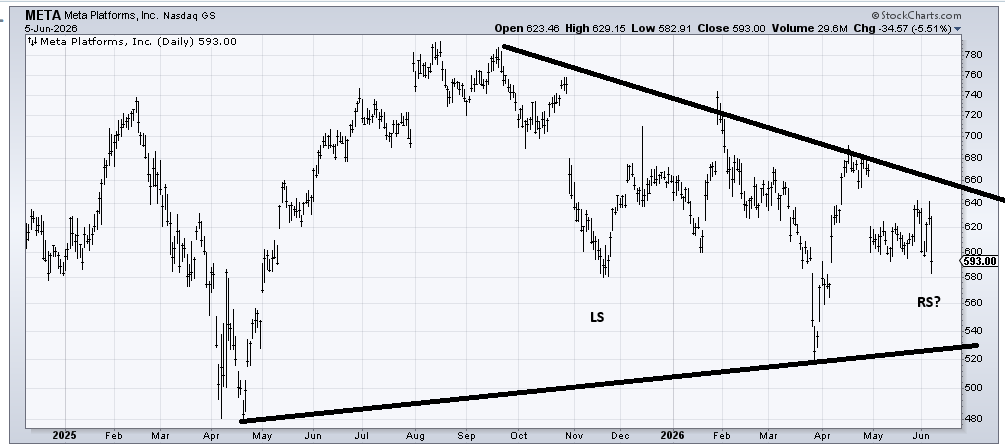
Meta’s (META) chart remains a hot mess. For such a large-cap stock, it trades like a small-cap one, gapping all over the place. About a month ago, I suggested that if you had a lot of patience, it was possible that with several months of sideways the stock might be forming the right shoulder of a head and shoulders bottom. I still think that is possible, but as I said then, it’s a wait-and-see and let it develop. If it breaks 580, then that will be off the table. So we ought to know soon enough.
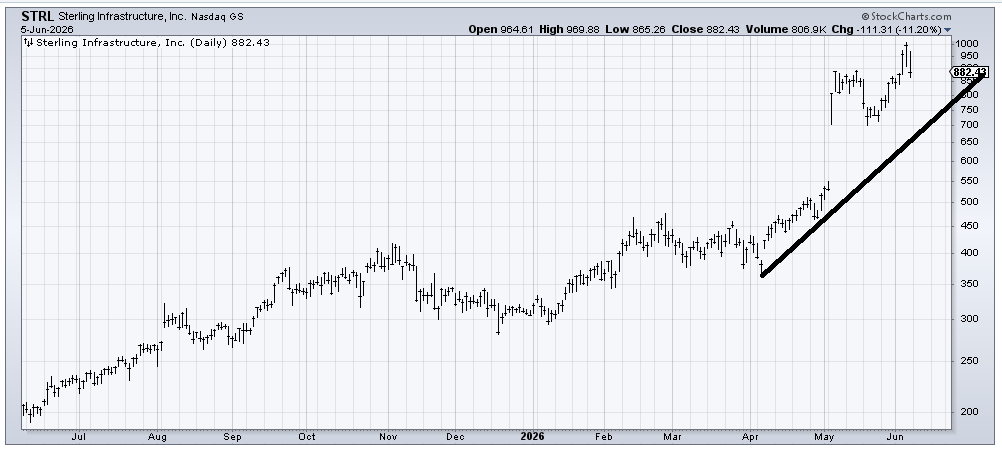
Sterling Infrastructure (STRL) hasn’t done anything wrong yet (no failing rally), but if it can’t hold over 850, then I would look for it to come down and tag that uptrend line, which next week would be in the same area as the two prior lows (700).
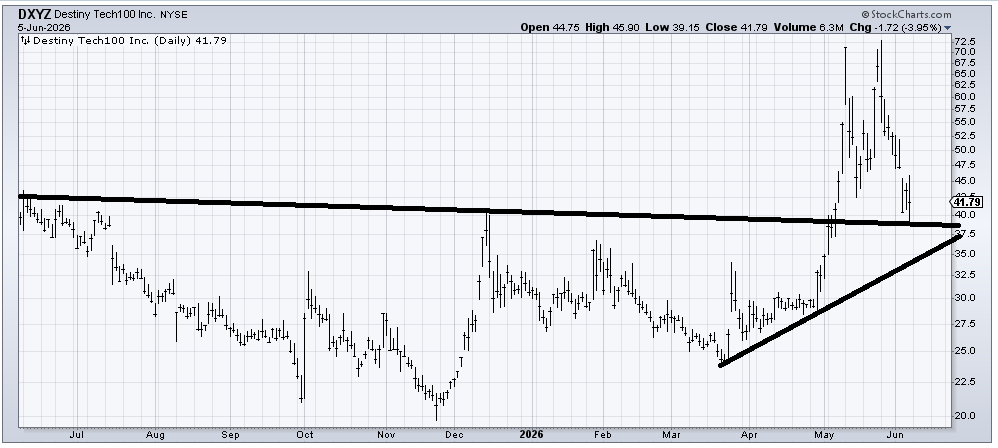
Destiny Tech100 (DXYZ) should try and hold in this 37-40 area. I’d like to see it mill around for a while to prove to me it wants to hold only because it has already reached its measured upside target from the base it broke out of in May. I would expect a bounce from that area. My only question is how sustainable such a bounce is. Time going sideways would make the bounce more sustainable.
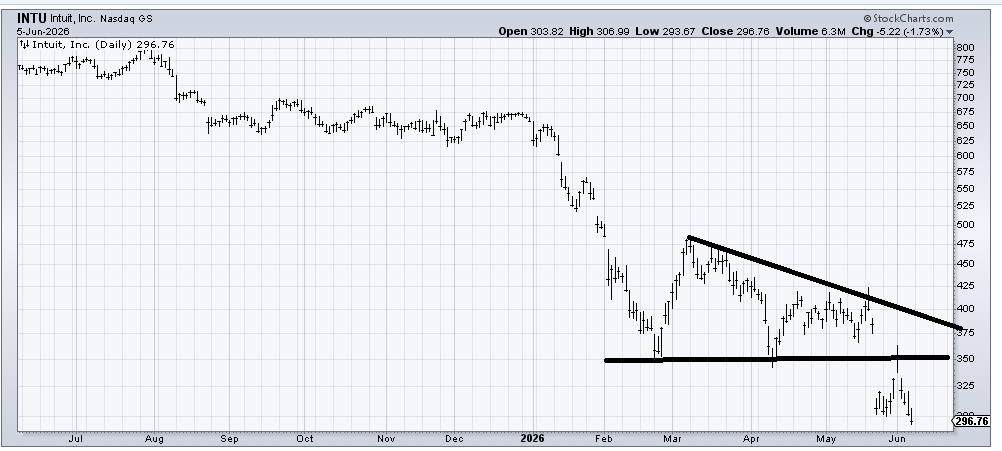
Intuit (INTU) tried to hold and form a base, but then gapped down, not exactly a vote of confidence. It is short-term oversold but that’s the best I can say. My guess is you should put this on your shopping list for the fourth quarter, as it might be a great tax-loss selling candidate.
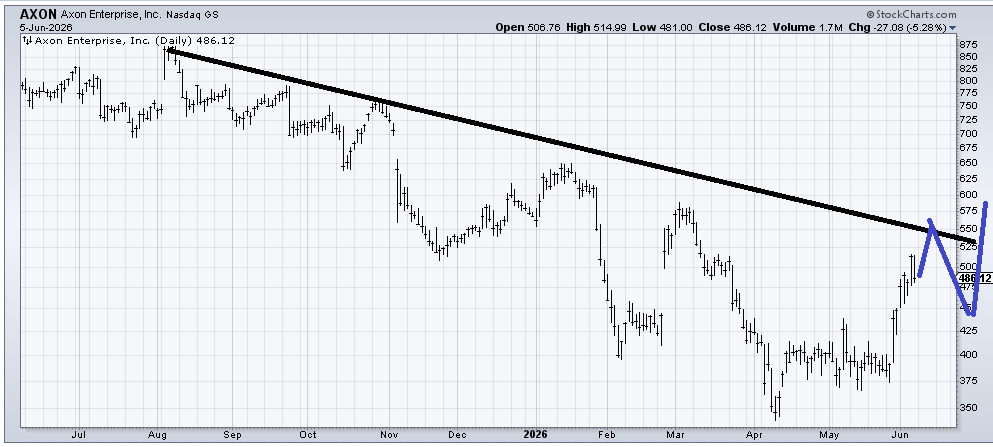
If Axon (AXON) can begin to map out over the next few months, something akin to what I have drawn in blue on the chart, then it could shape up as a decent stock in the back end of the year. The first thing it needs to do is make a higher high, something it has not done since August of last year.
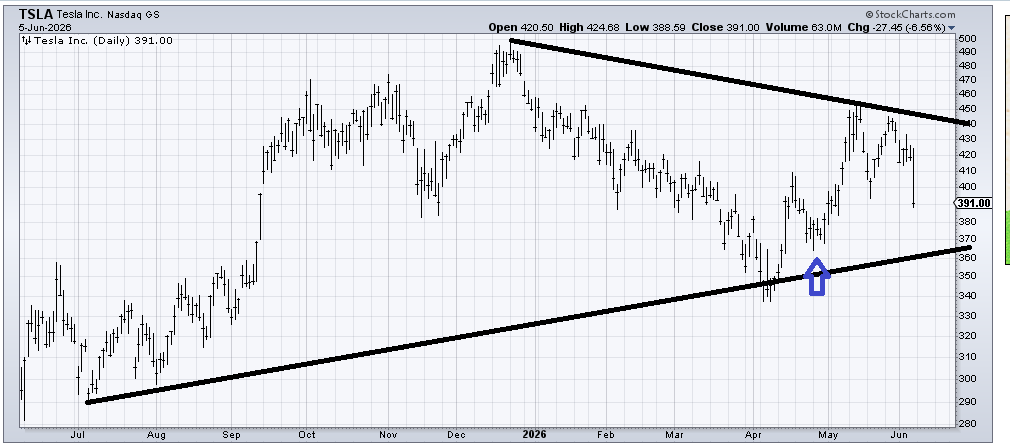
Tesla (TSLA) is the poster child for a former hot stock that has literally gone nowhere. I like to buy the stock when it comes down and spends a few days refusing to go much lower. We had a nice trade with that pattern coming off that late April low (arrow). I think it is possible Tesla will retest that area in the coming weeks, but mostly I would wait for the selling to dry up and the stock to spend some time churning before making a bet.
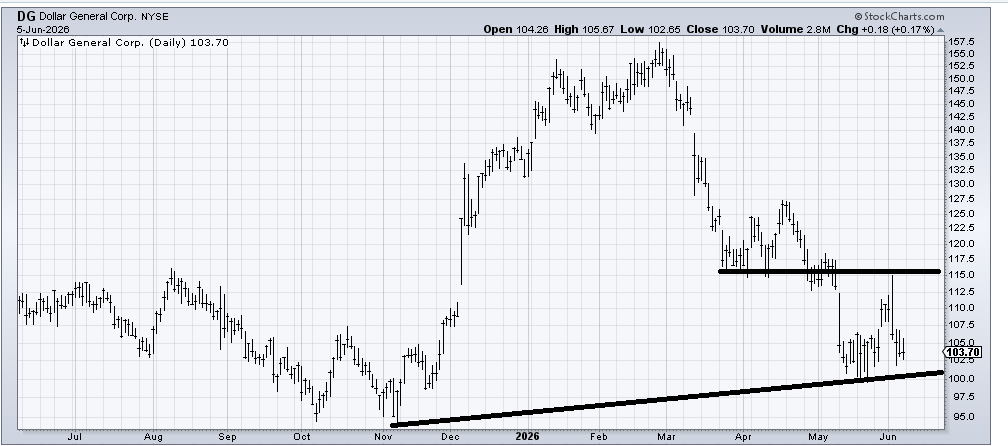
Dollar General (DG) feels like it’s getting a little oversold down here in this 100-102 area. It ought to set up for another trade back into that 112-115 area.