MarketAxess Is Pointed Still Lower
Shares of the electronic trading platform operator have been in a three-year decline, with no relief in sight.
You've reached your free article limit
You've read 0 of 1 free Pro articles.
MarketAxess Holdings Inc. MKTX is an international financial technology company that operates an electronic trading platform for the institutional credit markets, and also provides market data and post-trade services.
Let's check out the charts and indicators to set a strategy for the months ahead.
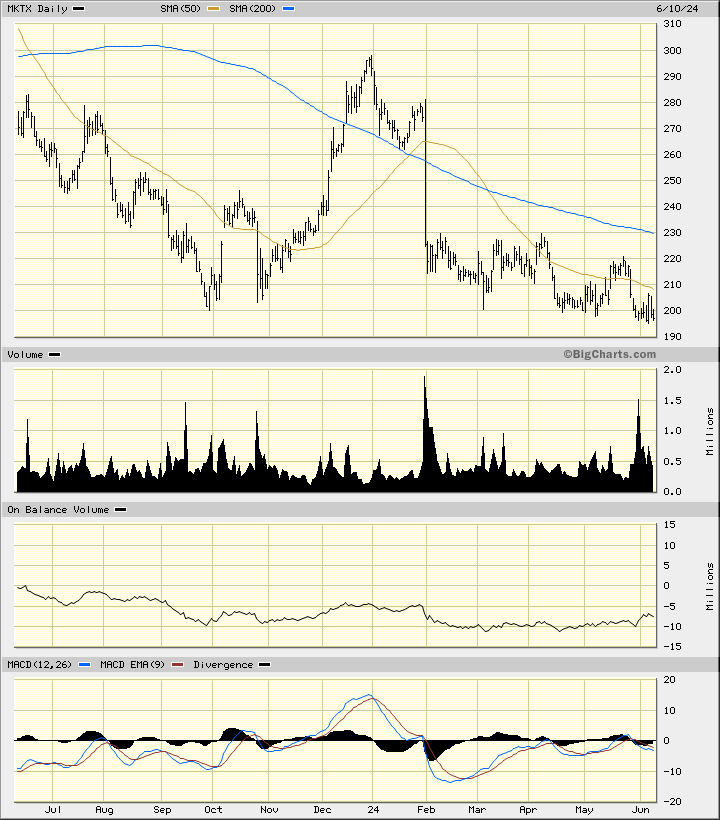
In the daily bar chart of MKTX, below, I can see that the shares have traded lower since late February. MKTX trades below the declining 50-day moving average line and below the declining 200-day moving average line.
The trading volume has been more active since February. The On-Balance-Volume (OBV) line shows weakness into the middle of April followed by a slight rise. The Moving Average Convergence Divergence (MACD) oscillator is slightly below the zero line.
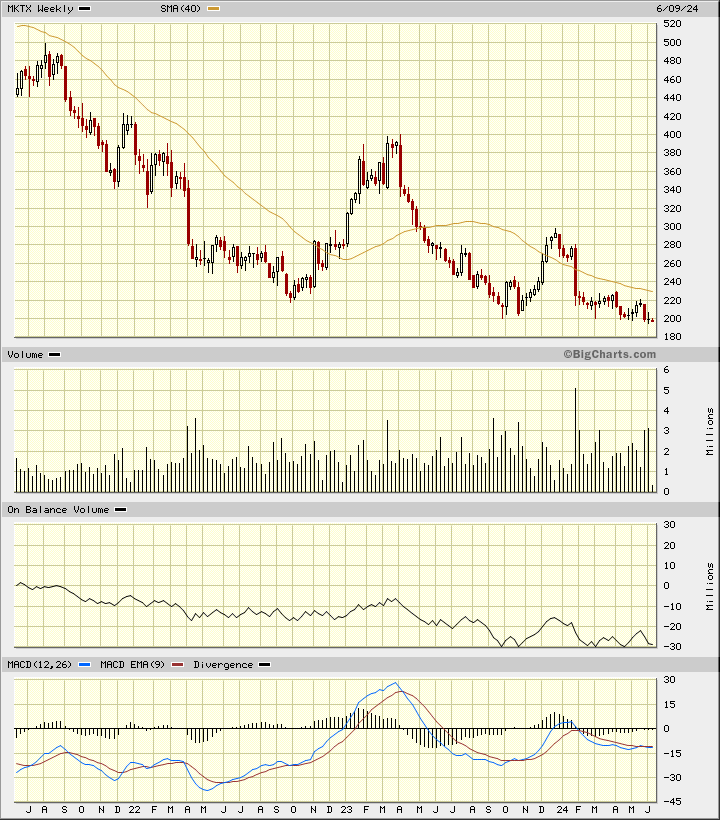
In the weekly Japanese candlestick chart of MKTX, below, I can see that the shares have been in a three-year decline. MKTX trades below the declining 40-week moving average line.
The weekly OBV line has been weak for the last three years. The MACD oscillator is in a bearish alignment below the zero line.
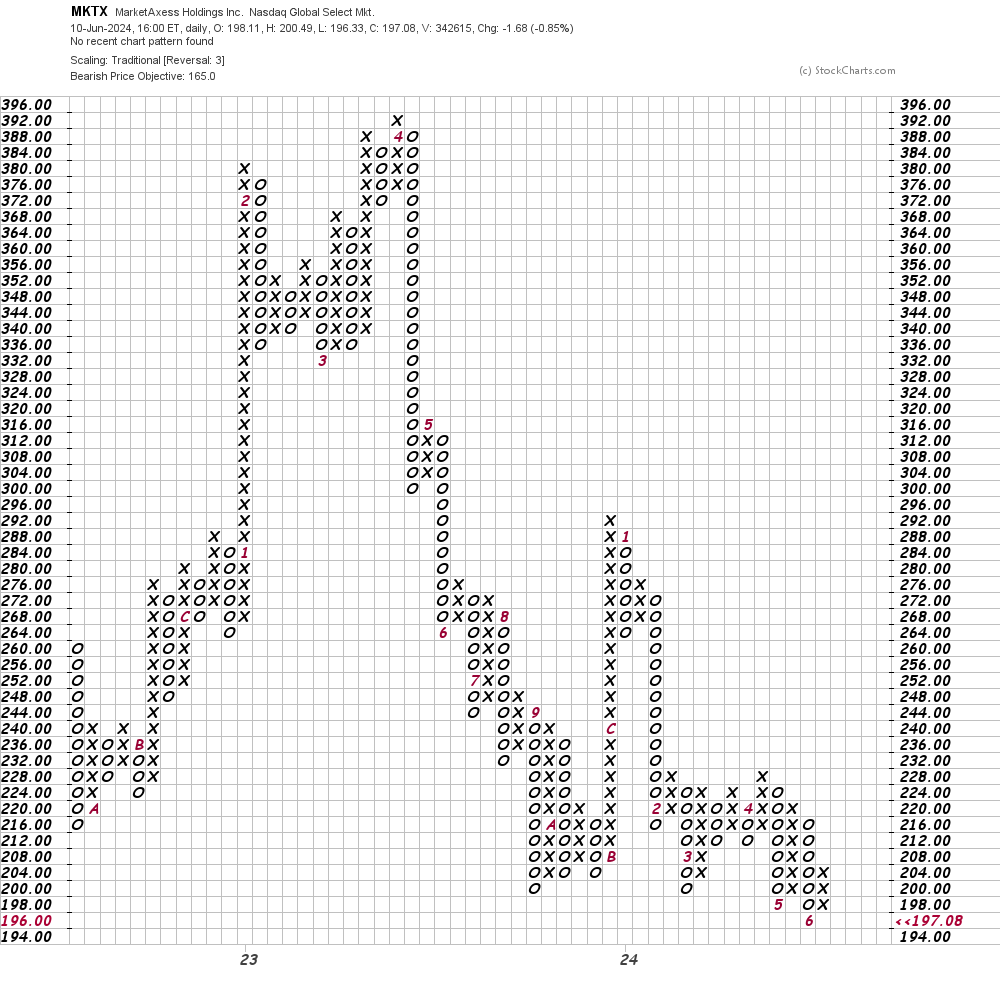
In this daily Point and Figure chart of MKTX, below, I can see a potential downside price target in the $165 area.
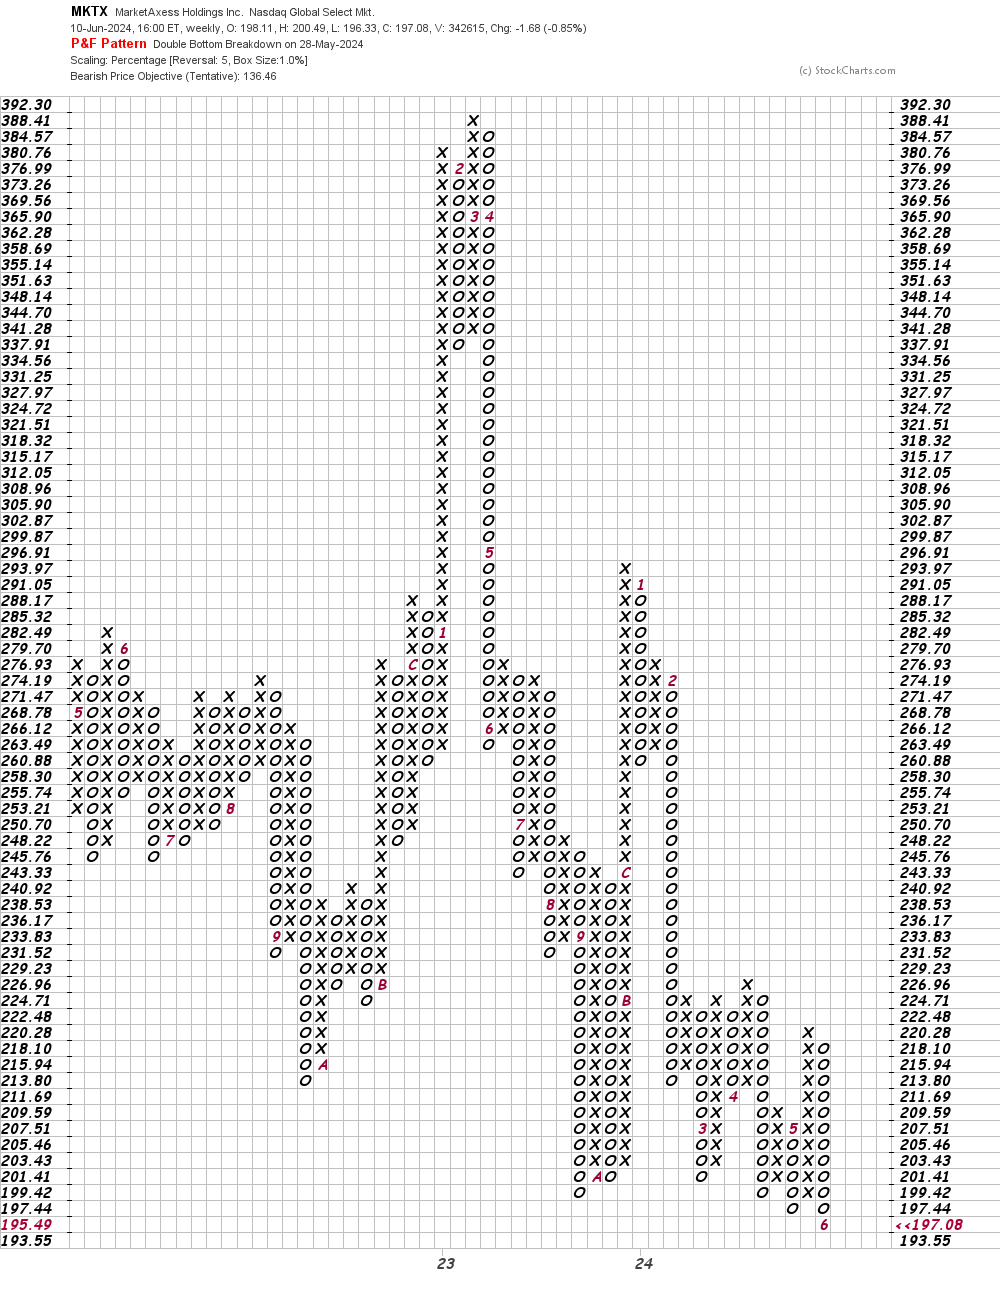
In this second Point and Figure chart of MKTX, below, I used weekly price data with a five-box reversal filter. Here the software points to a price target in the $136 area.
Bottom-line strategy: The charts and indicators of MKTX look bearish to me and traders should avoid the long side of MKTX as further declines look possible.
Employees of TheStreet are prohibited from trading individual securities.