Let's Run Some Tests on Abbott's Health
Despite an earnings beat, this health care name isn't looking so good on the charts.
You've reached your free article limit
You've read 0 of 1 free Pro articles.
Abbott Laboratories ABT reported on Thursday an adjusted earnings per share of $1.14, which beat estimates by $0.04. Revenue landed at $10.4 billion, which was $30 million higher than analyst estimates. Despite the beats, the stock made a new low for the move down Thursday.
Let's check out the charts and indicators for some guidance. The charts were bearish when I checked them back on April 17.
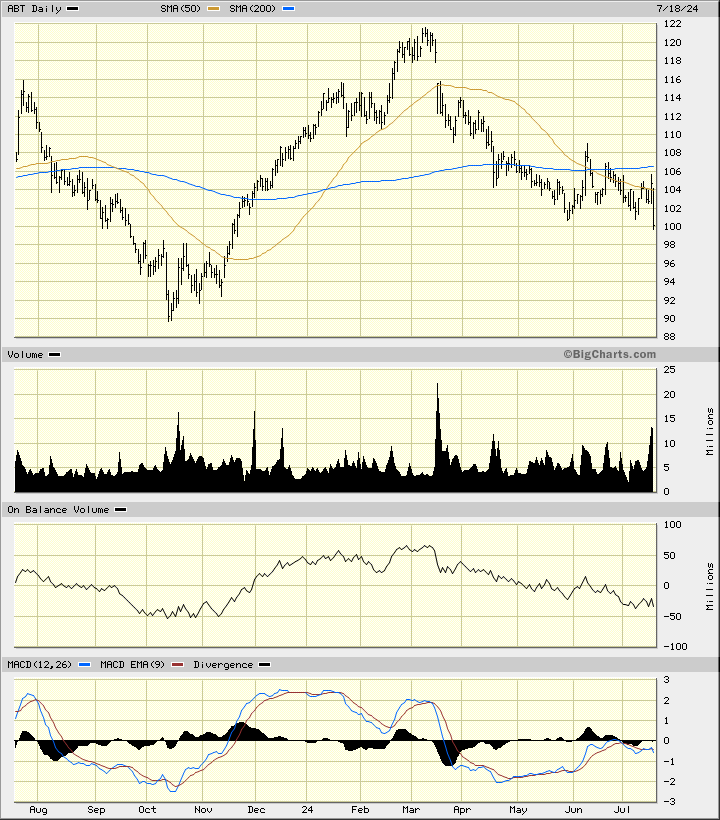
In this daily bar chart of ABT, below, I can see that prices have stayed below the flat 200-day moving average line and below the declining 50-day moving average line. Trading volume has been more active since the middle of March when prices reached a high.
The On-Balance-Volume (OBV) line has weakened since March and tells me that sellers of ABT have been more aggressive than buyers. The Moving Average Convergence Divergence (MACD) oscillator is in a bearish alignment below the zero-line.
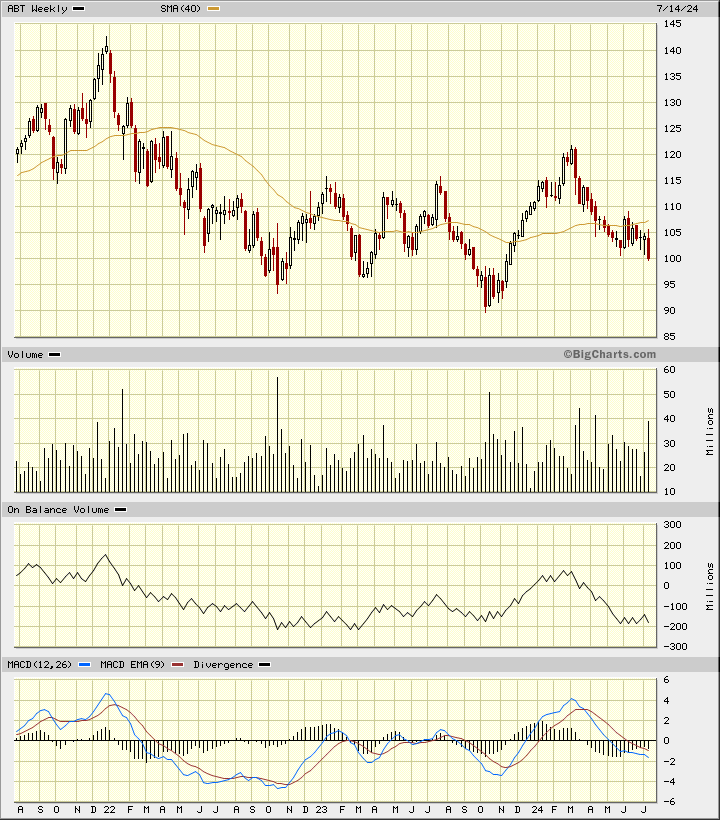
In this weekly Japanese candlestick chart of ABT, below, I can see that prices have swung in wider and wider up and down moves over the past two years. ABT trades below the 40-week moving average line. The weekly OBV line has been weak since February. The MACD oscillator is in a bearish alignment below the zero-line in this longer time frame. A retest of the lows of late 2023 is possible.
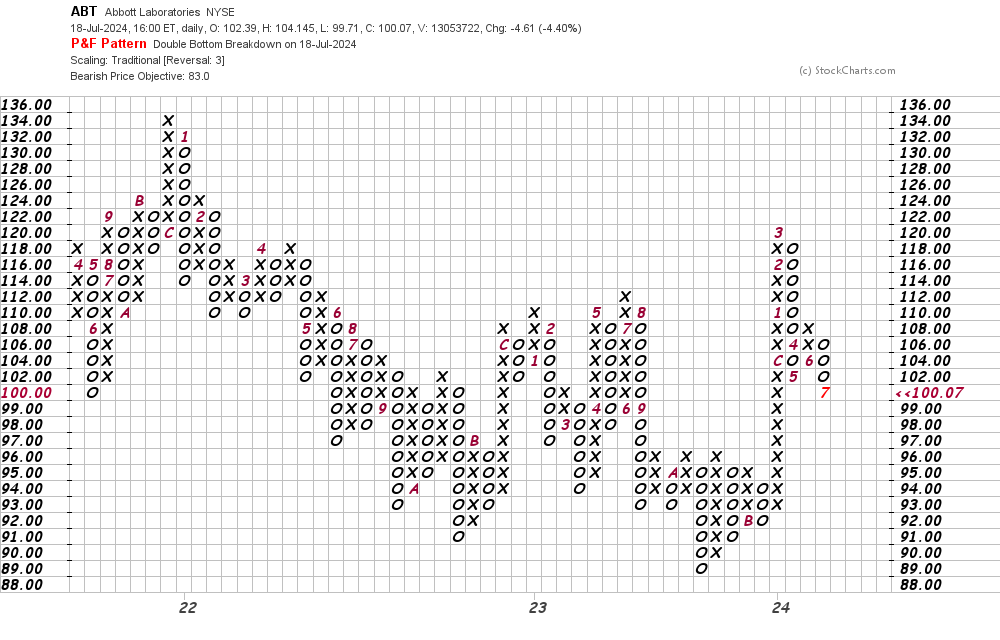
In this daily Point and Figure chart of ABT, below, I can see that the software is projecting a downside price target in the $83 area.
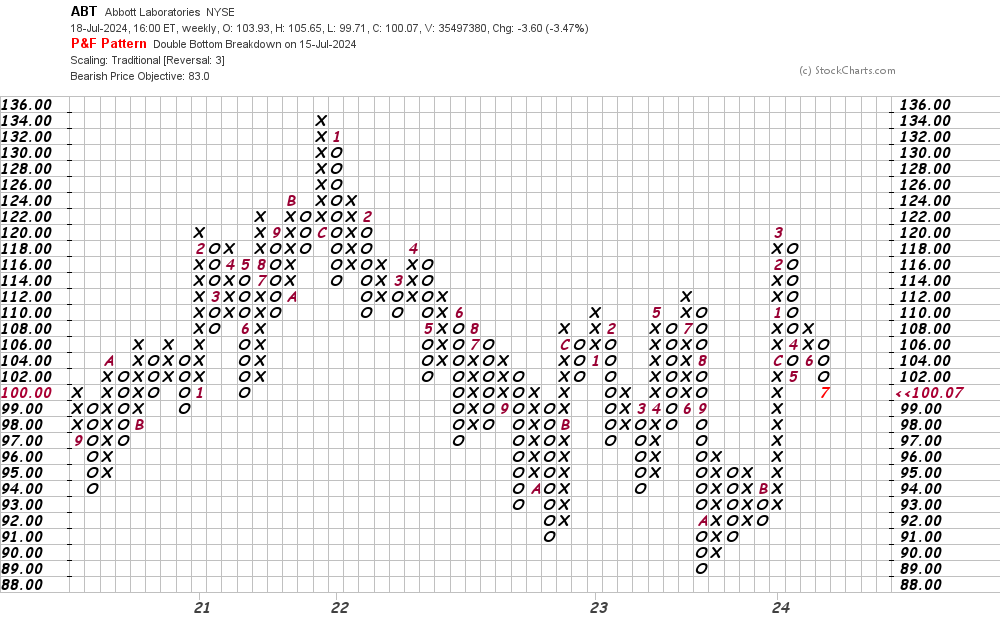
In this weekly Point and Figure chart of ABT, below, I can see the same $83 price target as shown on the daily chart above.
Bottom line strategy: ABT could make a short-term bounce, but the charts and indicators suggest we could see further declines in the weeks ahead.
Employees of TheStreet are prohibited from trading individual securities.