Let's Design a Trade Strategy on This Short-Squeezed, Low-Priced Stock
This name has fallen on hard times. But it's up big recently. If the trade fits...
You've reached your free article limit
You've read 0 of 1 free Pro articles.
Former Stocks Under $10 portfolio subscribers might remember this name. It was a successful trade for the portfolio that we had exited when it still ran with a $16 handle.
Well, Designer Brands DBI, the retailer of men's, women's, dress, casual and athletic shoes, has fallen on much harder times since.
Last week, the company released its second-quarter financial results, and they were not pretty. For the three-month period ended August 3, Designer Brands posted adjusted EPS of $0.29 (GAAP EPS: $0.24) on revenue of $771.9 million.
Both of these prints fell well short of expectations, with the adjusted earnings print missing by almost a quarter of a dollar and the revenue print reflecting year-over-year contraction for the sixth quarter of the past seven. The adjustments were made for the purposes of restructuring, integration and acquisition-related costs. Total comp sales were down 1.4%.
Designer Brands also lowered full-year guidance. For the full fiscal year of 2024, the company took its outlook for net sales growth down to "flat to low-single digits" from "low-single digits." It also lowered its projection for full-year adjusted EPS to $0.50 to $0.60 from $0.70 to $0.80.
Fundamentals
For the first six months of the fiscal year, Designer Brands generated $21.898 million in operating cash flow, down from $134.371 million for the first six months of the prior fiscal year. Out of this number, came $29.481 million in capex spending. This leaves the company with half-year free cash flow of -$7.583 million, down from $109.244 million for the year-ago comp.
Even with negative free cash flow, Designer Brands paid out $5.729 million in cash dividends to shareholders, while repurchasing $17.969 million in shares for the company's treasury. Incredibly, while the repurchase of common stock might seem almost irresponsible in this environment, it ended the reporting period with $69.7 million left in its current repurchase authorization.
Turning to the balance sheet, the company had a cash position of $38.834 million and inventories of $642.783 million, bringing current assets to $798.048 million. Current liabilities add up to $619.038 million, which does include $6.75 million worth of debt that will come due within 12 months.
These numbers leave the company's current ratio at 1.29, which is not really so bad. However, its quick ratio stands at a paltry 0.25. Now, we usually cut retailers some slack on their quick ratios due to the inventory-centric nature of the business. But we are a little concerned here as its cash balance is down 21% since February, while inventories, whose values often depreciate over time, are up 12.5% over that same time frame.
Total assets amount to $2.107 billion, including goodwill and other intangibles of $216.945 million. At 10.2% of total assets, this is not a problem. Total liabilities less equity comes to $1.748 billion, including a whopping $458.074 million in long-term debt. That's a lot of debt and its up almost 40% over the past 12 months.
The Stock Is Up Lately
DBI is up about 8.0% this Tuesday after being up 2.24% on Monday, after being up 11.73% on Friday. In fact, since the low of the past week ($4.36 on September 11), DBI is up around 47%.
That's incredible.
Why is that, after posting lousy numbers for the quarter, cutting guidance and running negative free cash flow for the past six months?
Short-Squeeze Please....
As of August 30, which is the most recent report I have, according to Morningstar... 93.78% of the entire DBI float was held in short positions. Average daily trading volume in this name over the past three months is 2.66 million shares. Over the past 10 days, the average daily trading volume is 4.58 million shares.
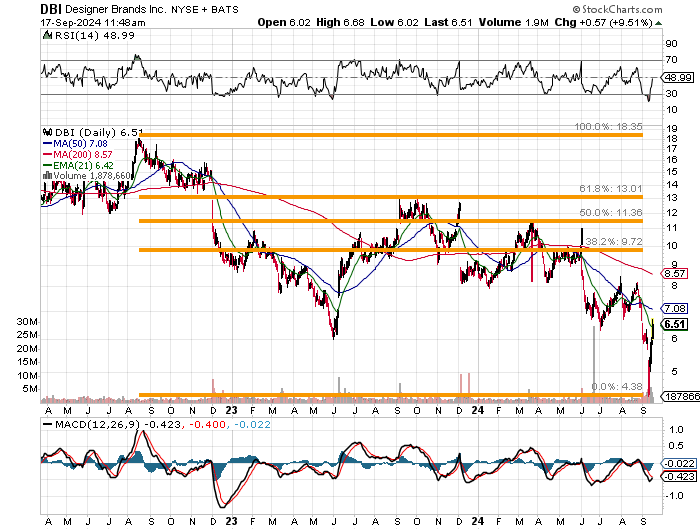
While I see absolutely no reason to invest in this stock, there could be a trade here.
With the stock's 50-day SMA (simple moving average) nearby, a jump over that hurdle could really scare the stuffings out of the shorts. You could have something along the lines of a potential meme stock situation here. Of course, the 200-day SMA looms at $8.57 and then there are key Fibonacci retracement levels above that, so this would not be a "set it and forget it" situation.
One who gets long something for a trade will have to either set stops as the stock rises or remain quite attentive.
I would not call this opportunity knocking, at least not in the traditional sense. What it is, is a possible pain trade for someone else that could turn a quick buck for those at the ready.
At the time of publictaion, Guilfoyle had no positions in any securities mentioned.
