Just Step Back and Absorb How Wild and Weird This Market Is
Let's look at we came from to where we are right now from multiple angles — and what that likely means for where we're headed. Plus, how I'd play Starbucks, AMD, and a potential 'Barron's pop.'
You've reached your free article limit
You've read 0 of 1 free Pro articles.
The Market
Let’s step back for a minute and note some important aspects of the market right now.
We went from a market where it was all mega-cap (mostly) tech stocks that rallied to a massive, once-in-a-generation unwind of that. That means we went from a market where the Nasdaq’s net volume was positive for three weeks of trading (trust me, that’s a very long streak, maybe even a record) to the Nasdaq’s net volume being negative for three straight days, which is the longest such streak in three months.
Then we have that massive move in the small-caps (the Great Unwind) that got everyone all excited and bullish. But then after that massive run-up we have the Russell 2000 giving up 3% in a matter of days.
So the step back is to say, look how many wild-and-weird type statistics we have seen in these last few months. Some may say the markets have changed. Sure, in some ways they have. But in my experience wild moves tend to occur at bottoms or tops. Yet we’ve had a bifurcated market for so long that while these last two weeks worked to correct that, we still have a market that is not oversold and we have a market where some of the sentiment indicators are at levels we don’t see very often.
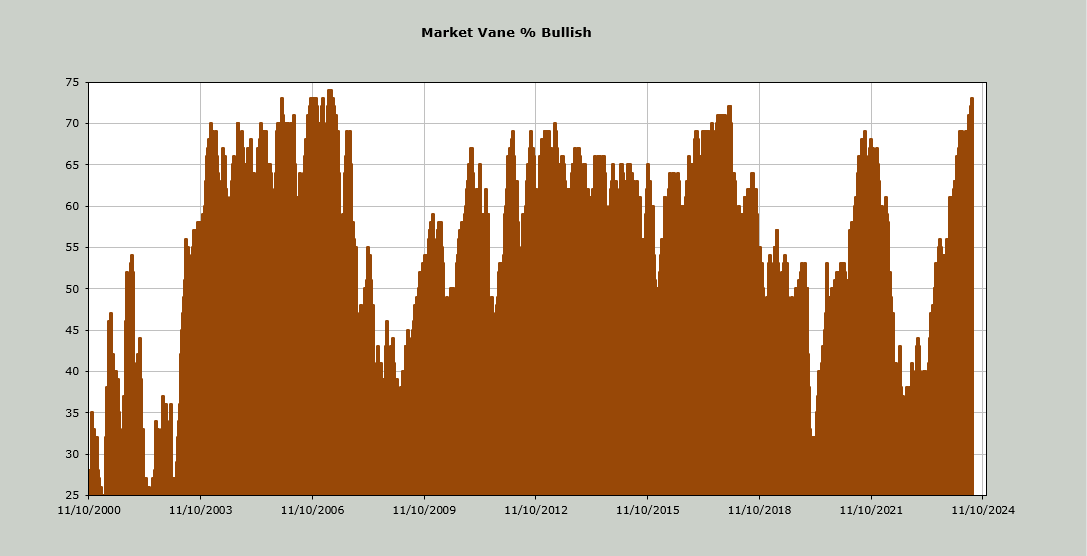
For example, the Market Vane Bulls. They are at 73. They do not get into this area very often. They are now the highest since they were 74 in May 2007. You might say, well, heck, we still had five more months before the S&P 500 made its high. But know that levels like this are not what we see when the "market" is embarking on a brand new bull run.
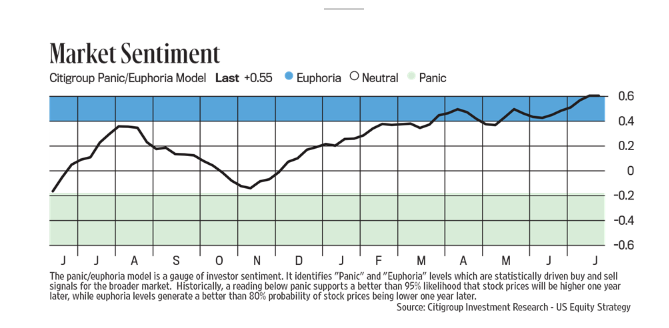
Meanwhile, we have the Citi Panic/Euphoria model very well ensconced in "Euphoria" — for months now. So sure, because it has been there for months, maybe we should ignore it, or maybe we should understand that this is also not where sentiment is when the "market" is embarking on a brand new bull run.
I could go on, but the Investors Intelligence bulls at 63% are the same situation. The American Association of Individual Investors (AAII) bulls over 50%, same thing.
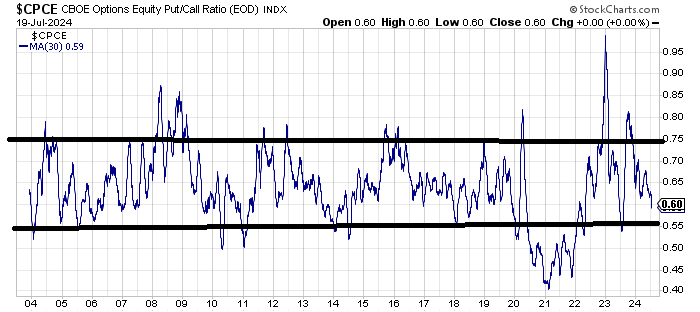
Then there is the 30-day moving average of the equity put/call ratio. It is now just under 0.60. Within the next week or so I expect it will be closer to 0.55 (it’s the math). While I have not included a chart of the S&P along with this the first thing you should notice is how infrequently this gets down to that mid-50s area.
Even if you squint at that 2020-2022 period you can see it slipped just under 0.55 right before we had the March 2020 Covid decline. In other words, here is another sentiment indicator that is not where we typically see it just before a big run upward. Those tend to be readings over 0.75, such as we had last fall.
So when I draw an uptrend line on the chart of the QQQs, or the S&P and show that we’re at support and it appears to me as if we should rally, understand that is more a comment on ebbing and flowing right now, rather than a true oversold condition.
I have been pegging late July as the point where we should get overbought on an intermediate-term basis (thus why I think we should have ‘one more rally’ into late July). Perhaps my timing will be off but all signs point to a rocky August, in my work. In other words, I believe something needs to show up to reset sentiment.
New Ideas
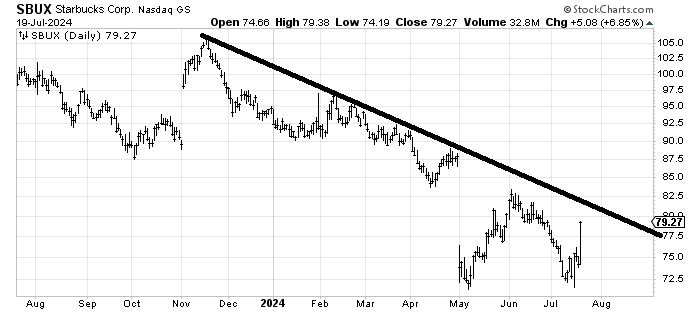
Last week I noted the "W" pattern forming in Starbucks SBUX and Friday we got news that Elliot Management had taken a stake in the company. I consider that pure luck that we caught that move. My rule of thumb is you take something off the table when you get that sort of move on news.
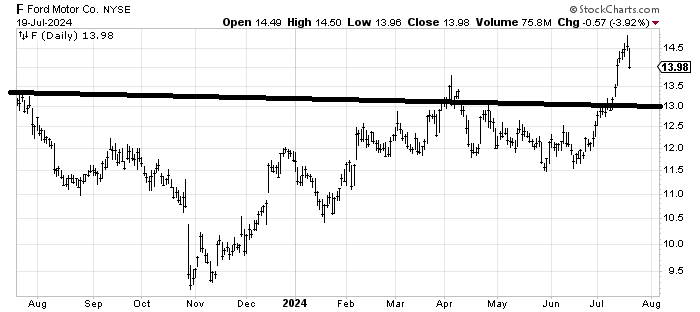
Just prior to my vacation in mid-June I recommended Ford F. It has had a great run. This weekend Barron’s highlights it (positively). While my target is close to $16 I would say if you bought it back there at $12 it’s a good idea to take something off the table if you get a Barron’s pop.
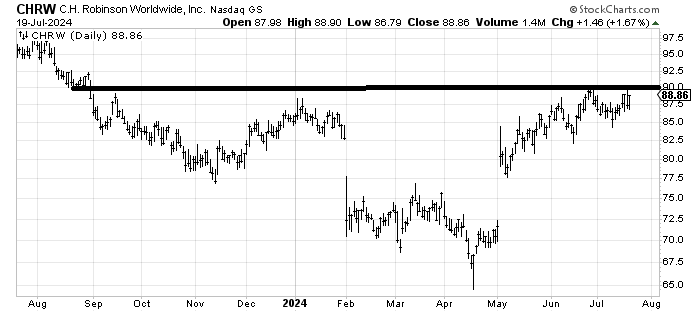
I have my eye on C.H. Robinson Worldwide CHRW because if the stock can get through $90 I think it can have a quick pop into the mid-$90s.
Today’s Indicator
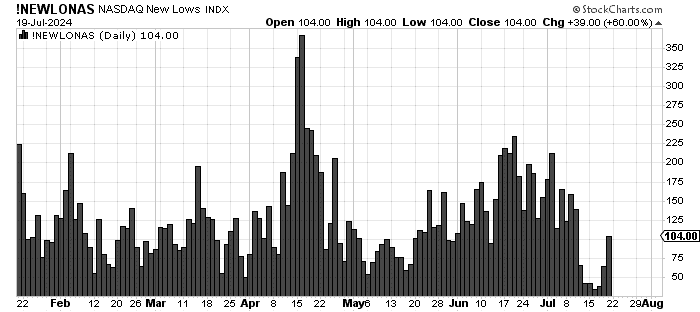
After watching new highs for weeks, I’m back watching the new lows because the Nasdaq’s surged back over 100 on Friday
Q&A/Reader’s Feedback
Helene welcomes your questions about Top Stocks and her charting strategy and techniques. Please send an email directly to Helene with your questions. However, please remember that TheStreet.com Top Stocks is not intended to provide personalized investment advice. Email Helene here.
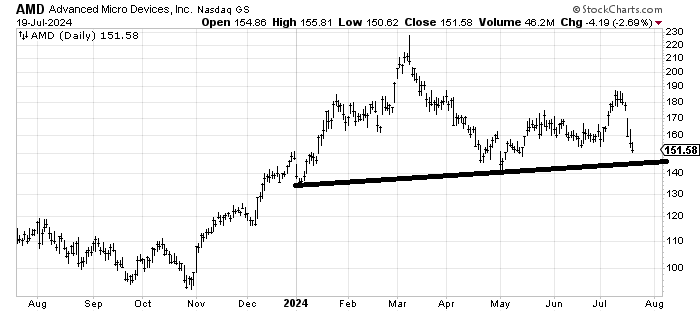
If I told you that Advanced Micro Devices AMD was flat on the year you might think I was nuts. Yet it is. It has some good support down here around $145-150, however, so I would look for a short-term bounce from this area. My only question is if that short-term support area can withstand a proper correction in the market indexes. So right now it’s only a short-term bounce.
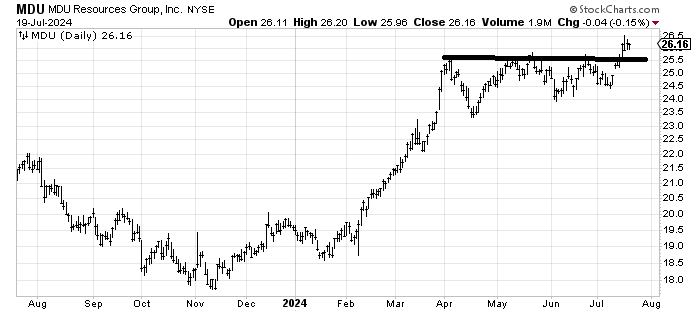
MDU Resources MDU had a nice little breakout that stalled. Yet that breakout only measures to $27-28 so it is hard for me to get excited about it at $26. I’ll call it a hold with a stop under $25.
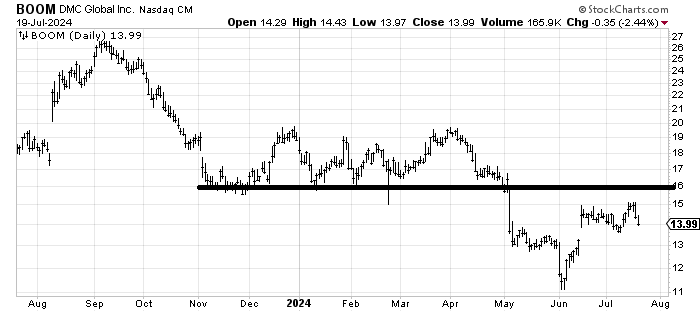
DMC Global BOOM is going to need to do a lot of work before I have any confidence that it can trade back up and over $16-ish. For now the June low looks like it should hold (spike lows like that tend to hold on any revisit down there the first trip down) but that’s the best I can say right now.
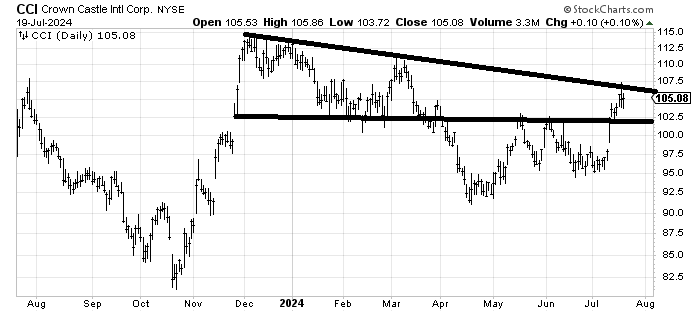
Crown Castle CCI intrigues me. The stock's got resistance all the way up but it’s trying to eat through it. I do not want to see it trade back under that lower line ($102-ish), though, and I would like to see it cross that upper line to break the downtrend it has been in all year. Is that big dividend safe? If it is, it makes the chart even more interesting.