Is That 'It' or Should We Brace for More Downside?
Let's study the indicators, volume, a 'jumpy' VIX and bonds to see what's next. And for a short-term rally, I've identified the most oversold area. Plus, are BofA and Google bounce candidates?
You've reached your free article limit
You've read 0 of 1 free Pro articles.
The Market
In the very short term we’re a little bit oversold. Only a little bit? Yes.
While the market did not end Friday with 90% of the volume on the downside — we did get to just over 90% midday — we closed with 83% of the volume on the downside. That is often the sign of a very short-term oversold condition.
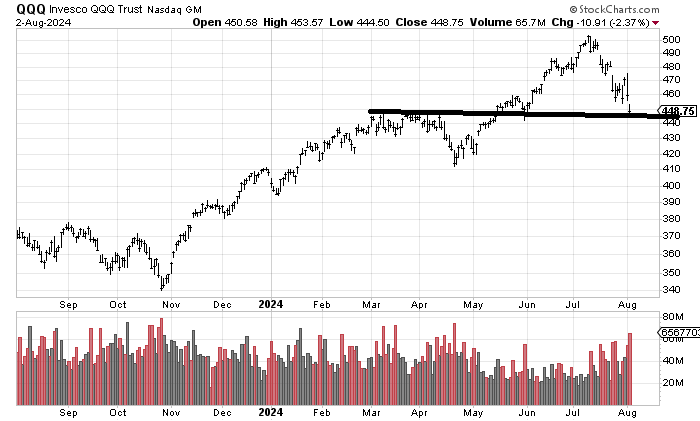
While I would not call the volume in the QQQs (Invesco QQQ Trust) capitulatory, I will note that it was the highest volume (65 million shares) we have seen since April (we saw 75 million shares then). High-volume declines will often lead to short-term rallies.
There is also some support in this $440 area on the QQQs.
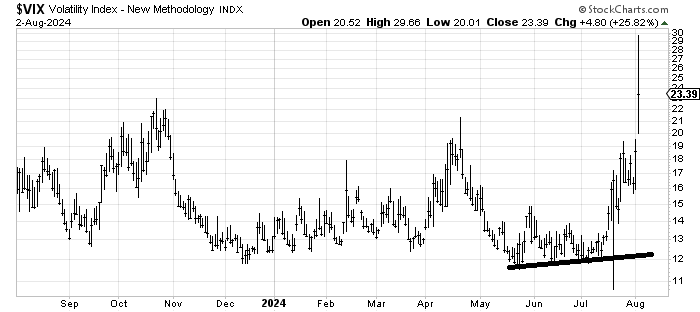
In the middle of July I noted the higher lows the VIX was making and how it typically portended more volatility. The VIX looked to me as if it got jumpy on Friday. Jumpy is a very subjective term and is difficult to explain, but I view it as if you look at the chart and it appears to be breaking out, as if you would want to jump on board such a breakout. A jumpy VIX is often what we get before a short-term rally.
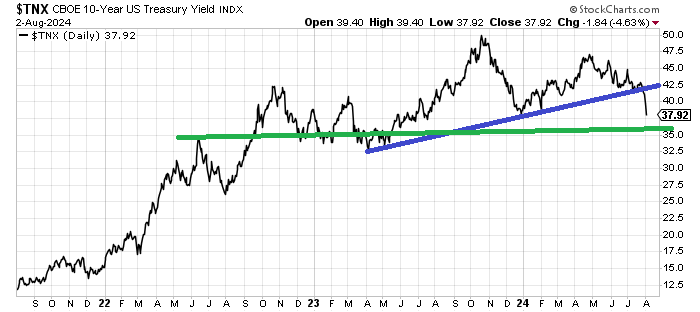
When I look at the chart of the yield on the 10-Year Treasury Note, we have clearly broken the trend line (blue), but it is fast approaching support near that green line (3.5-3.6%). I suspect longer term we’ll see that green line break but for now that should suffice. I will also note that the DSI for the Bonds is now at 86. I would say we’re in the neighborhood that says "enough" for now.
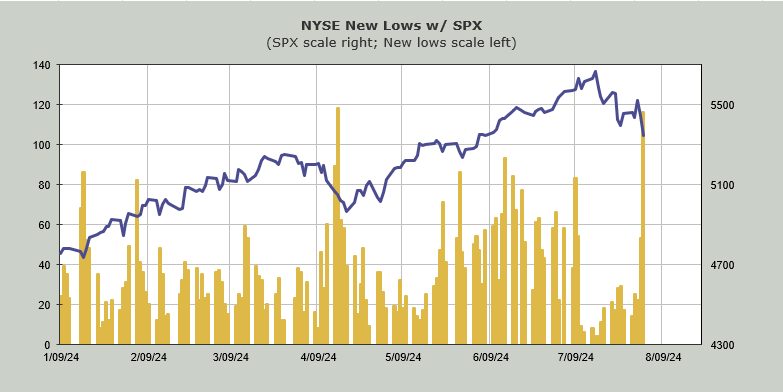
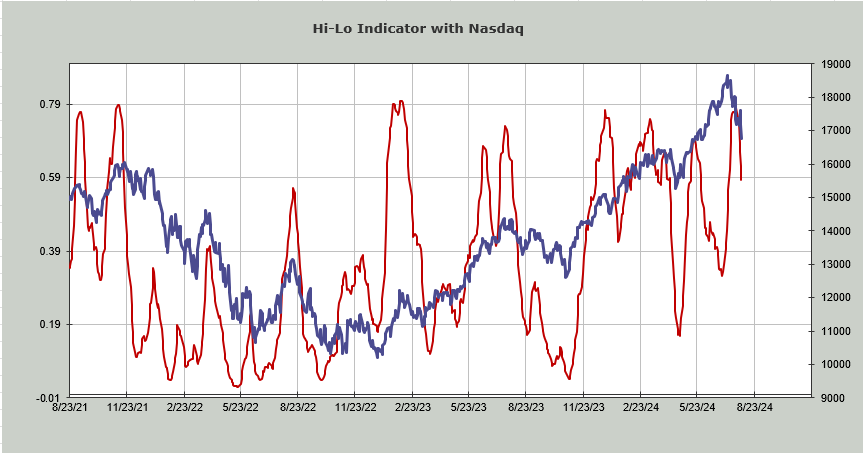
So why can’t this be "it"? It can except that all those intermediate-term indicators only just got overbought last week. For example, down below you will see the Nasdaq Hi-Lo Indicator is only at 0.58, nowhere near oversold. And the Nasdaq (and the NYSE) had the most number of stocks making new lows since April when the indexes were much lower. At some point we need to see new lows contract.
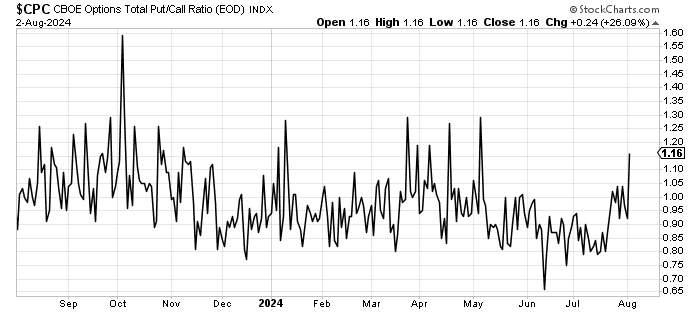
And we need sentiment to change. Oh sure, last week went a long way toward shifting the sentiment but it takes time for sentiment to properly shift on the intermediate-term indicators. For example, look at the put/call ratio. It zipped right up to 1.16 on Friday, showing the first/early signs of some fear. But look at the March/April period when it climbed up there (or really higher) several times over the course of a few weeks.
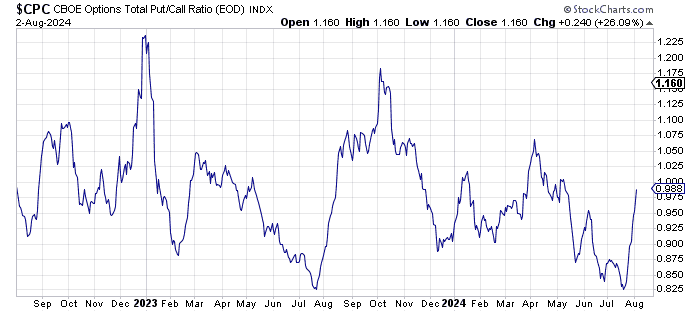
The 10-day moving average is now knocking on the door of 1.0; in April it was higher. At the fall lows of 2022 and 2023 it was significantly higher. And we already know the 30-day moving average of the equity put/call ratio has only just last week ticked up from the high 50s so that is not in any place that says we should just resume the rally from here.
New Ideas
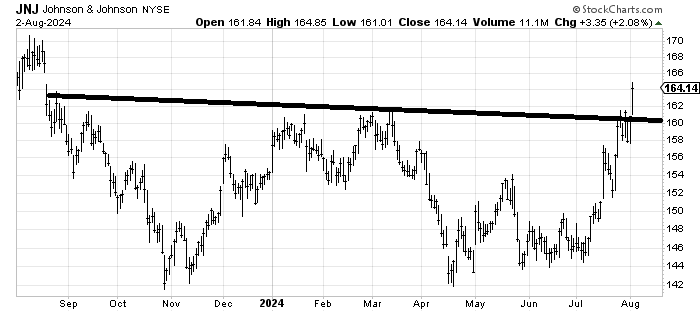
It’s been a few months since I recommended Johnson & Johnson JNJ and it took its sweet time getting going, but on Friday it finally managed to break out. And it filled that gap from almost a year ago. Typically it should, over the course of the next few weeks, have a short-term peak and a pull back. If you are trading it, I’d take something off the table here but if you want to buy the stock, I’d take a look at it again in the $158-160 area.
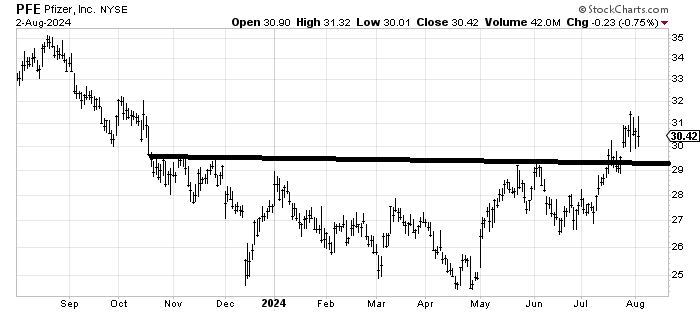
Notice that Pfizer PFE, another name I have liked in recent months, had what looks like a breakout a few weeks ago but there was no follow-through. Patience is required. A pullback to the $28-29 area should be buyable.
If you want to play for a short-term rally, the most oversold area is the QQQs.
Today’s Indicator
The Hi-Lo Indicator is discussed above.
Q&A/Reader’s Feedback
Helene welcomes your questions about Top Stocks and her charting strategy and techniques. Please send an email directly to Helene with your questions. However, please remember that TheStreet.com Top Stocks is not intended to provide personalized investment advice. Email Helene here.
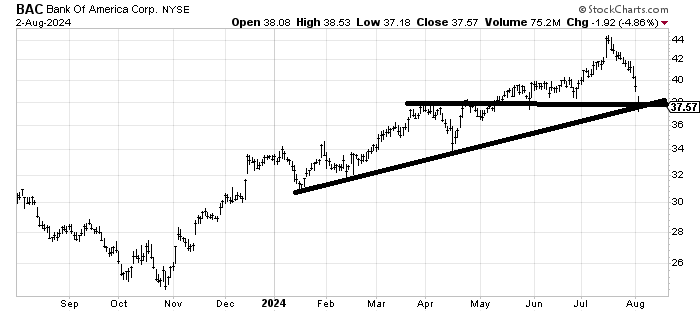
I still don’t like the banks but Bank of America BAC is down about 15% since I turned sour on the group and it does have support here. I would say it’s a bounce candidate. The one thing that would have me believe it can do more than bounce short term would be if the stock gaps up over $39 and holds it. Otherwise, if you get a bounce in the $39-40 area, I’d sell it there.
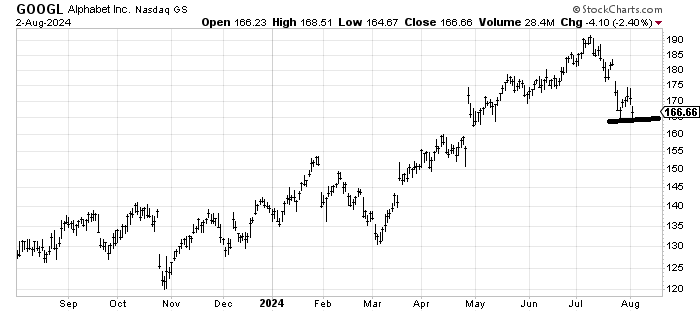
I have been waiting for Alphabet GOOGL to fill that gap at $160 and it hasn’t done so. And Friday it did not make a lower low. So if it holds Friday’s low area it is a bounce candidate. If it fills the gap around $160 it is a bounce candidate. But only a trade for now.
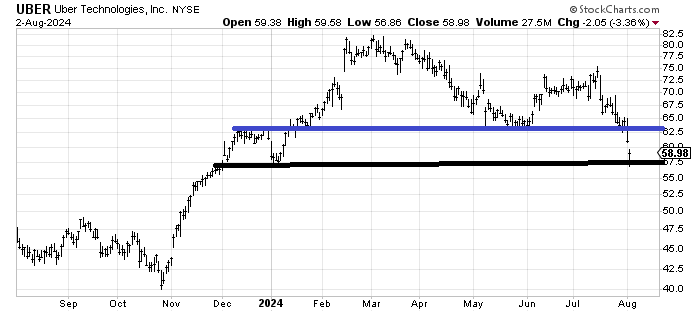
Uber UBER has collapsed completely but it, too, is oversold. The top it broke down from measures to the $45-50 area so for now I think it can bounce into that low $60s area where I’d be a seller.