Is Microchip Technology Ready to Make an Upside Breakout?
Here are my new price targets for now.
You've reached your free article limit
You've read 0 of 1 free Pro articles.
Microchip Technology MCHP develops, manufactures, and sells smart, connected, and secure embedded control solutions in the Americas, Europe, and Asia.
It's above my pay grade so let's check out the charts and indicators.
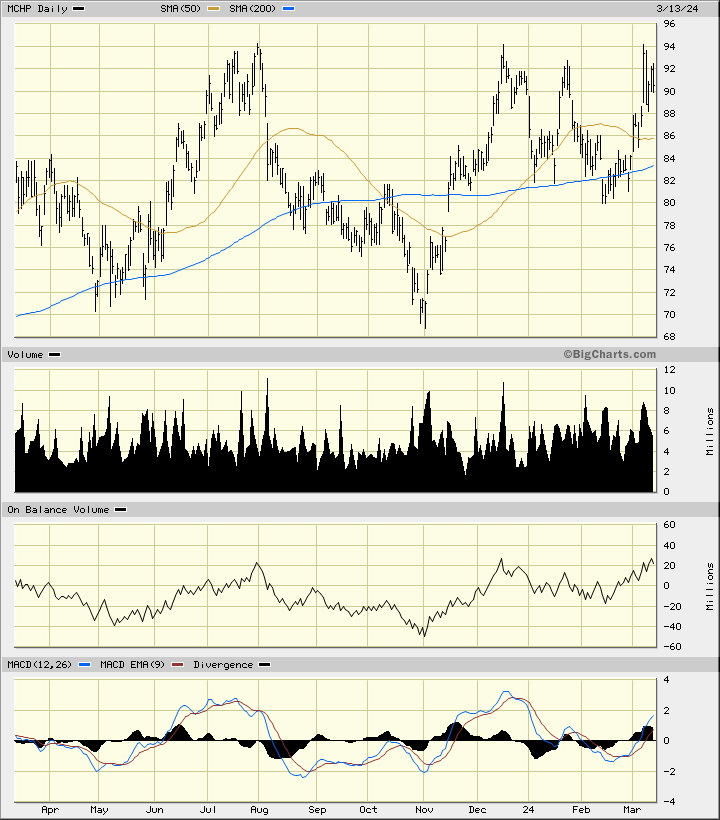
In this daily bar chart of MCHP, below, I can see that prices have tested the $94 area a number of times in the past few months. Prices trade above the rising 50-day moving average line and above the rising 200-day moving average line.
The On-Balance-Volume (OBV) line shows us a positive overall trend the past year. The Moving Average Convergence Divergence (MACD) oscillator has recently crossed above the zero line for a fresh outright buy signal.
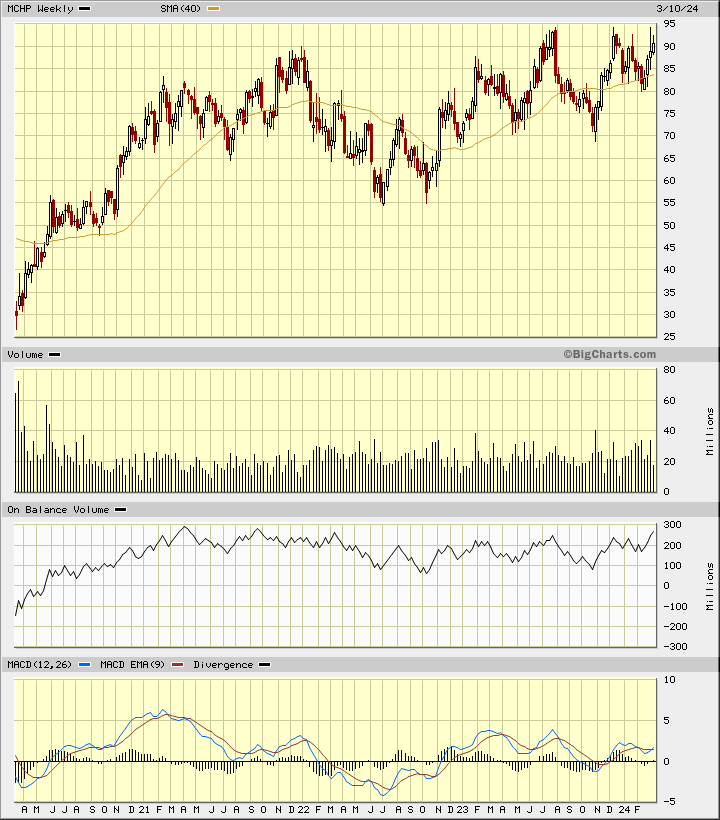
In this weekly Japanese candlestick chart of MCHP, below, I can see that prices have been moving higher since 2022. Prices trade above the rising 40-week moving average line. The weekly OBV line shows strength since October and is not far away from making a new high for the move up.
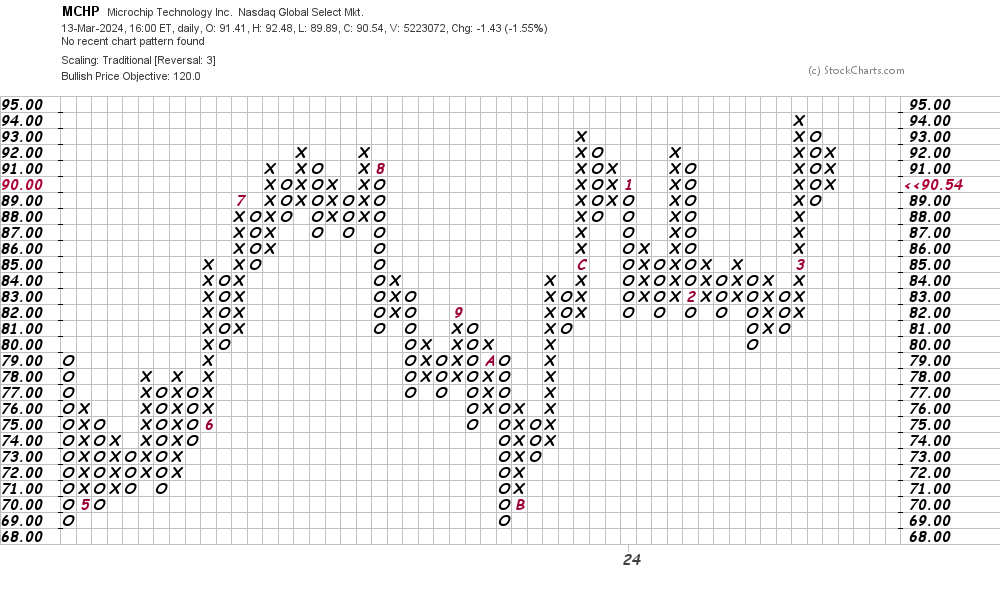
In this daily Point and Figure chart of MCHP, below, I can see an upside price target in the $120 area.
In this weekly Point and Figure chart of MCHP, below, I can see a slightly higher price target in the $122 area.
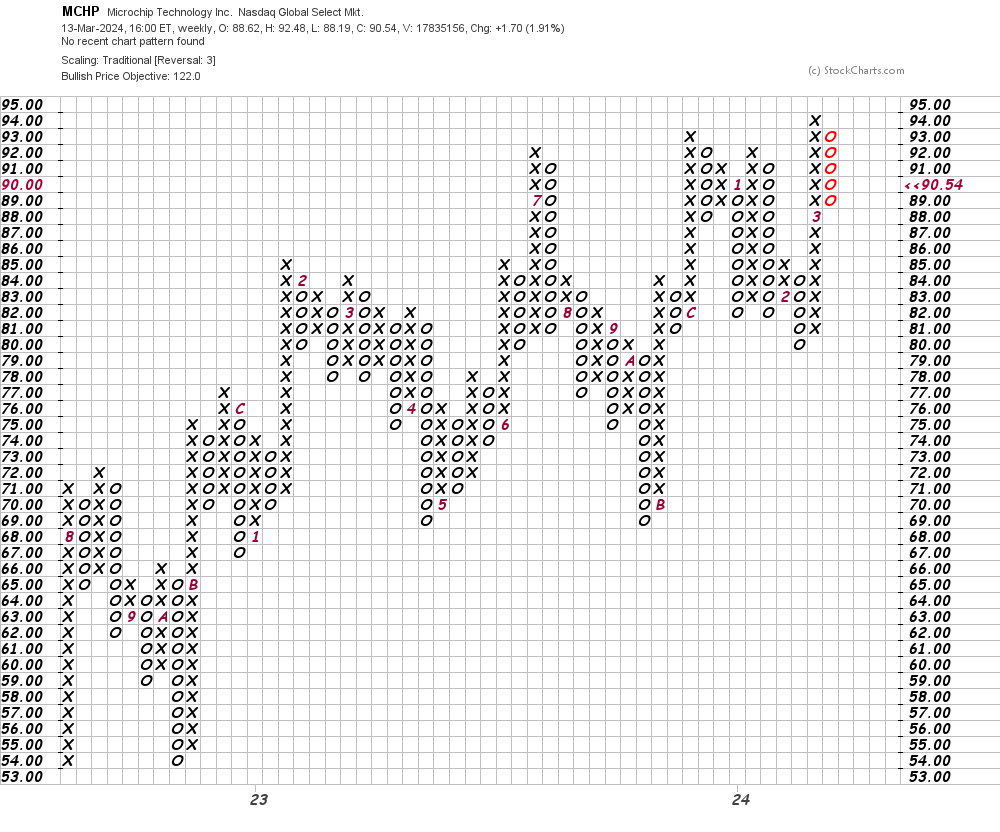
Bottom line strategy: Traders could go long MCHP on strength above $94. Risk to $86. The $120-$122 area is my price target for now.
Employees of TheStreet are prohibited from trading individual securities.