Invesco QQQ Trust Is Heading for More Choppy Action
A closer look at the price data around the Invesco QQQ Trust suggests a bearish flag setup.
You've reached your free article limit
You've read 0 of 1 free Pro articles.
This is where the proverbial rubber meets the road.
You are probably sitting on a nice little gain if you caught the low last week or grabbed some early-year tech winners on the early August dip. And that feels good after a rough July. But where is the bounce headed?
The current levels are a challenge for bulls. We closed right on the 10-day exponential moving average (EMA) yesterday, which has been a bit of a problem; however, bulls may have another $8 to $9 upside on the Invesco QQQ Trust QQQ as the 21-day EMA has been significant resistance.
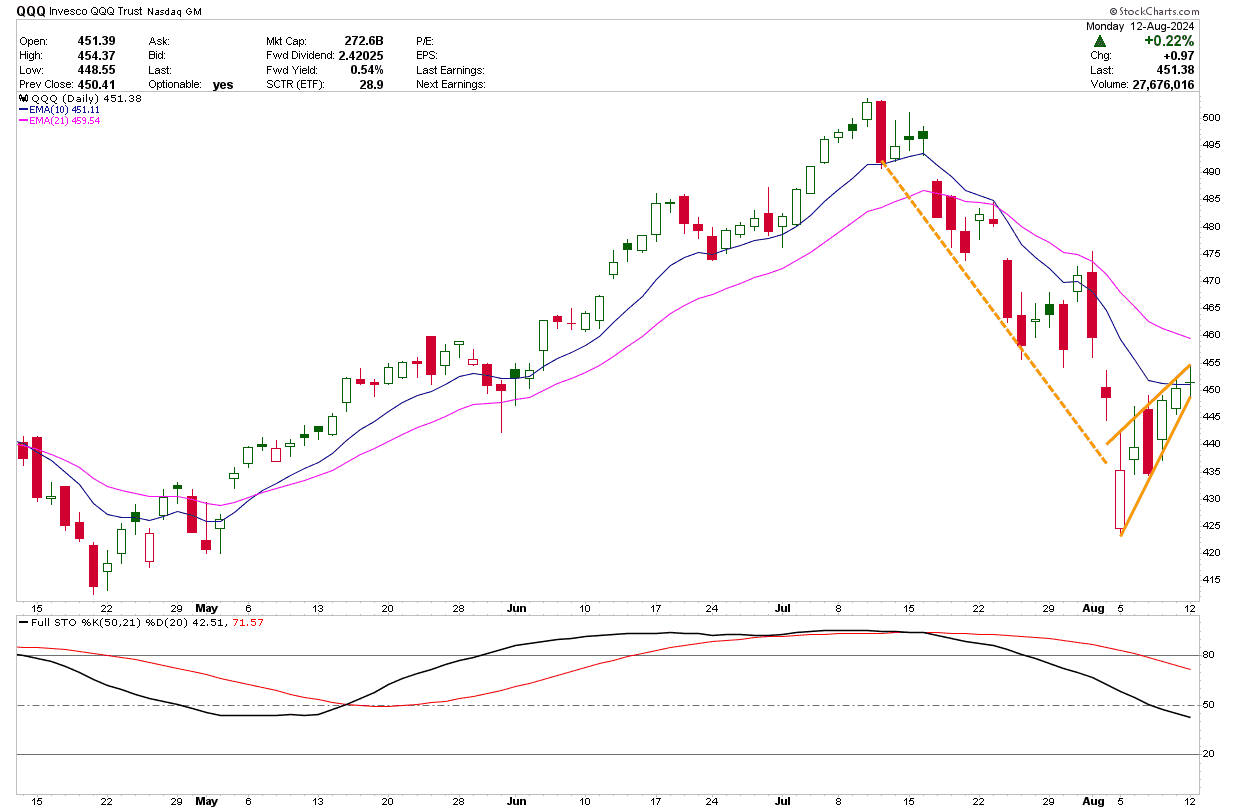
The recent bounce has created a bearish flag setup. If we do push to $460, the price may extend enough to break the pattern; however, if it takes a few days to develop, the greater likelihood is that the pattern will continue.
A break below $435 a second time could create a roundtrip in 2024, erasing huge gains on the year.
While I’m conservative on my exposure to QQQ right now, I don’t think we roundtrip on the year, but the next few months will likely continue choppy action.
Although I focus mostly on price action and basic exponential moving averages, I like to include an elongated full stochastics indicator for long-term trends. This isn’t an indicator that will call exact tops or exact bottoms, but it does a solid job of indicating when it is better to buy and hold, buy dips in an uptrend, or sell rallies after a decline.
During strong bullish moves, the black line (%K) and the red line (%D) will be above 80, or overbought territory. When the black begins to lose altitude compared to the red, it’s time to tighten stops. When it falls below 80, the trend is broken, at least in the short term. Bounces are best for selling until the black crosses back above the red.
Once the black crosses above the red, I look more aggressively at long-side trades. Although not required, I prefer to see the price above at least the 21-day EMA, if not the 10-day EMA. Again, this isn’t for calling tops and bottoms, but it helps recognize trends versus chop or drop.
At the time of publication, Byrne had no positions in any securities mentioned.