Inspecting the Market's Cracks
A proliferation of bearish patterns across diverse companies and sectors have appeared. Let's look at the S&P, the 10-Year, retail stocks, Palantir and more.
You've reached your free article limit
You've read 0 of 1 free Pro articles.
Last week, I wrote an article that covered two very important topics — a topping pattern that appeared on the chart of the S&P 500, and the breakout in the 10-Year Treasury note’s yield.
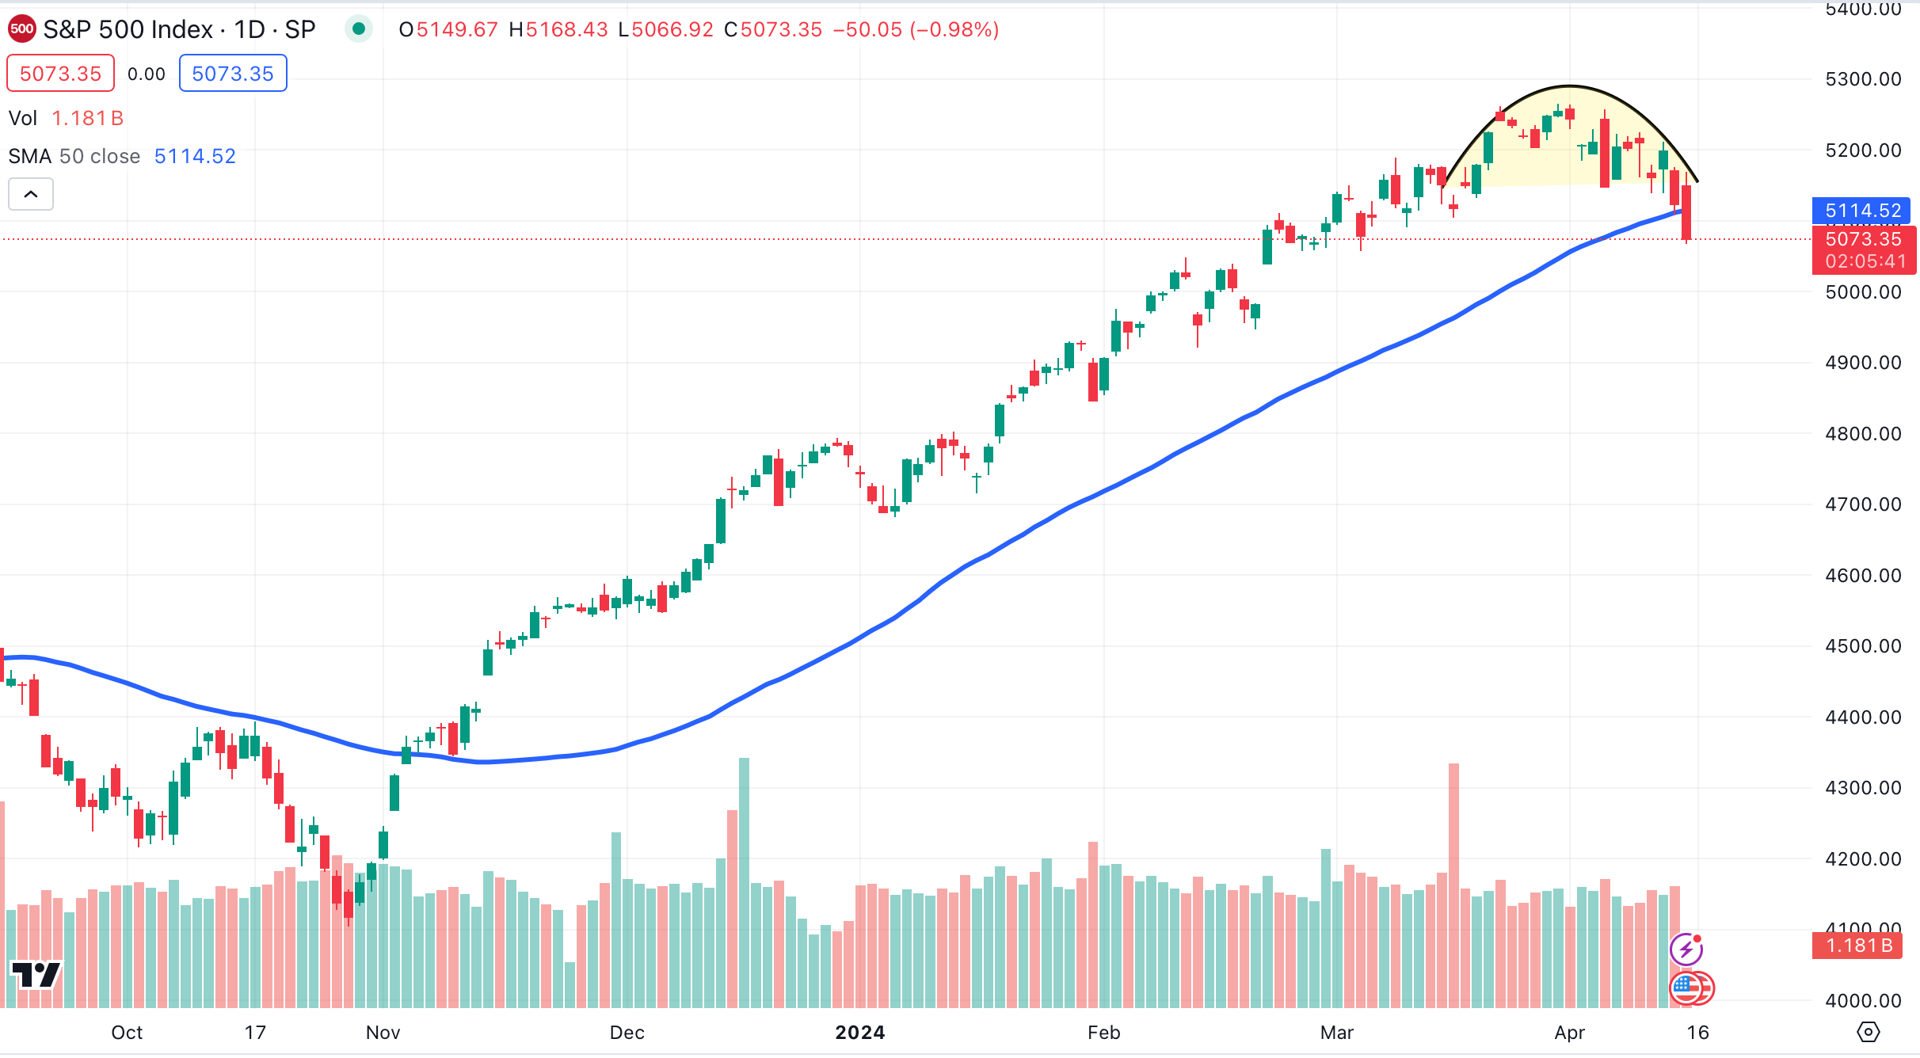
Last week’s charts were telegraphing Monday’s market activity. On Monday, the S&P shed 1.2%, causing the large-cap index to break down from the bearish formation.
Our prediction of a pullback to between 5000 and 5100 has already occurred. We’re maintaining our target of 5375 for the index.
The S&P 500 has closed below its 50-day moving average (blue) for the first time this year. S&P futures were up sharply ahead of the decline, highlighting the market’s recent inability to hold on to gains.
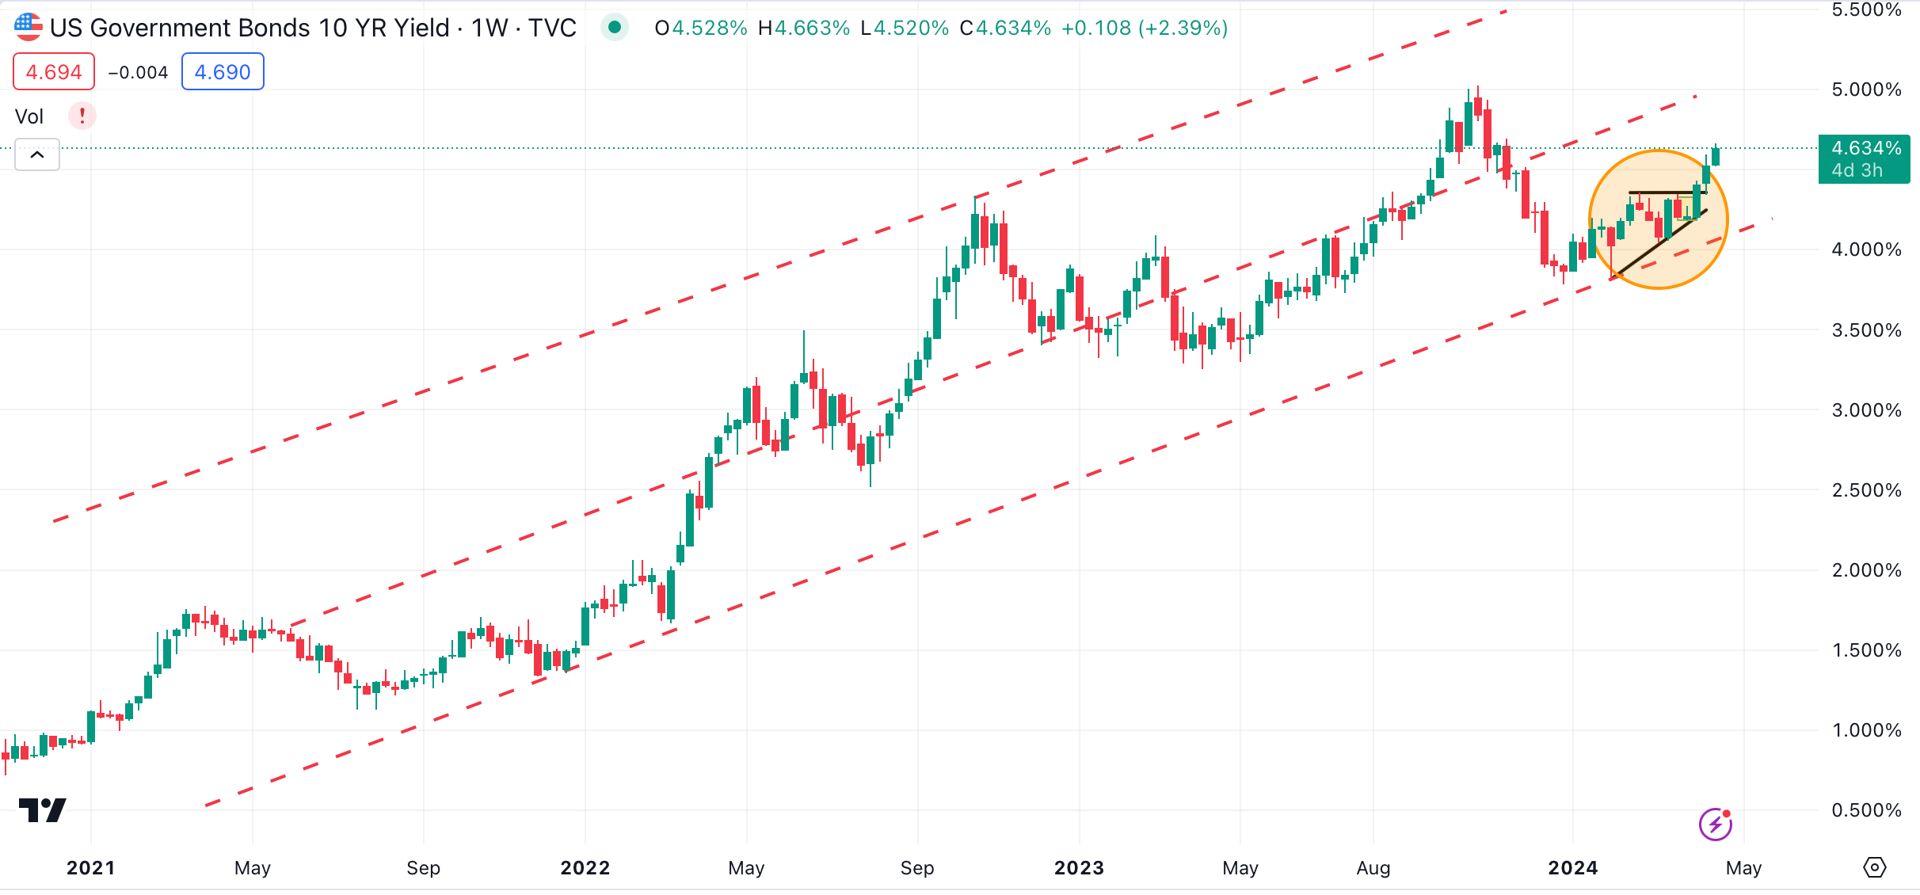
The yield on the 10-Year note hit 4.66%, up 31 basis points since breaking out of a bullish ascending triangle pattern (shaded orange) last week. On the weekly chart, we see that the 10-Year’s yield has been trending higher for several years (red dotted lines). From this perspective, a move to 5% isn’t out of the question.
One topic that has many technical analysts chattering is the proliferation of bearish patterns across diverse companies and sectors. For example:
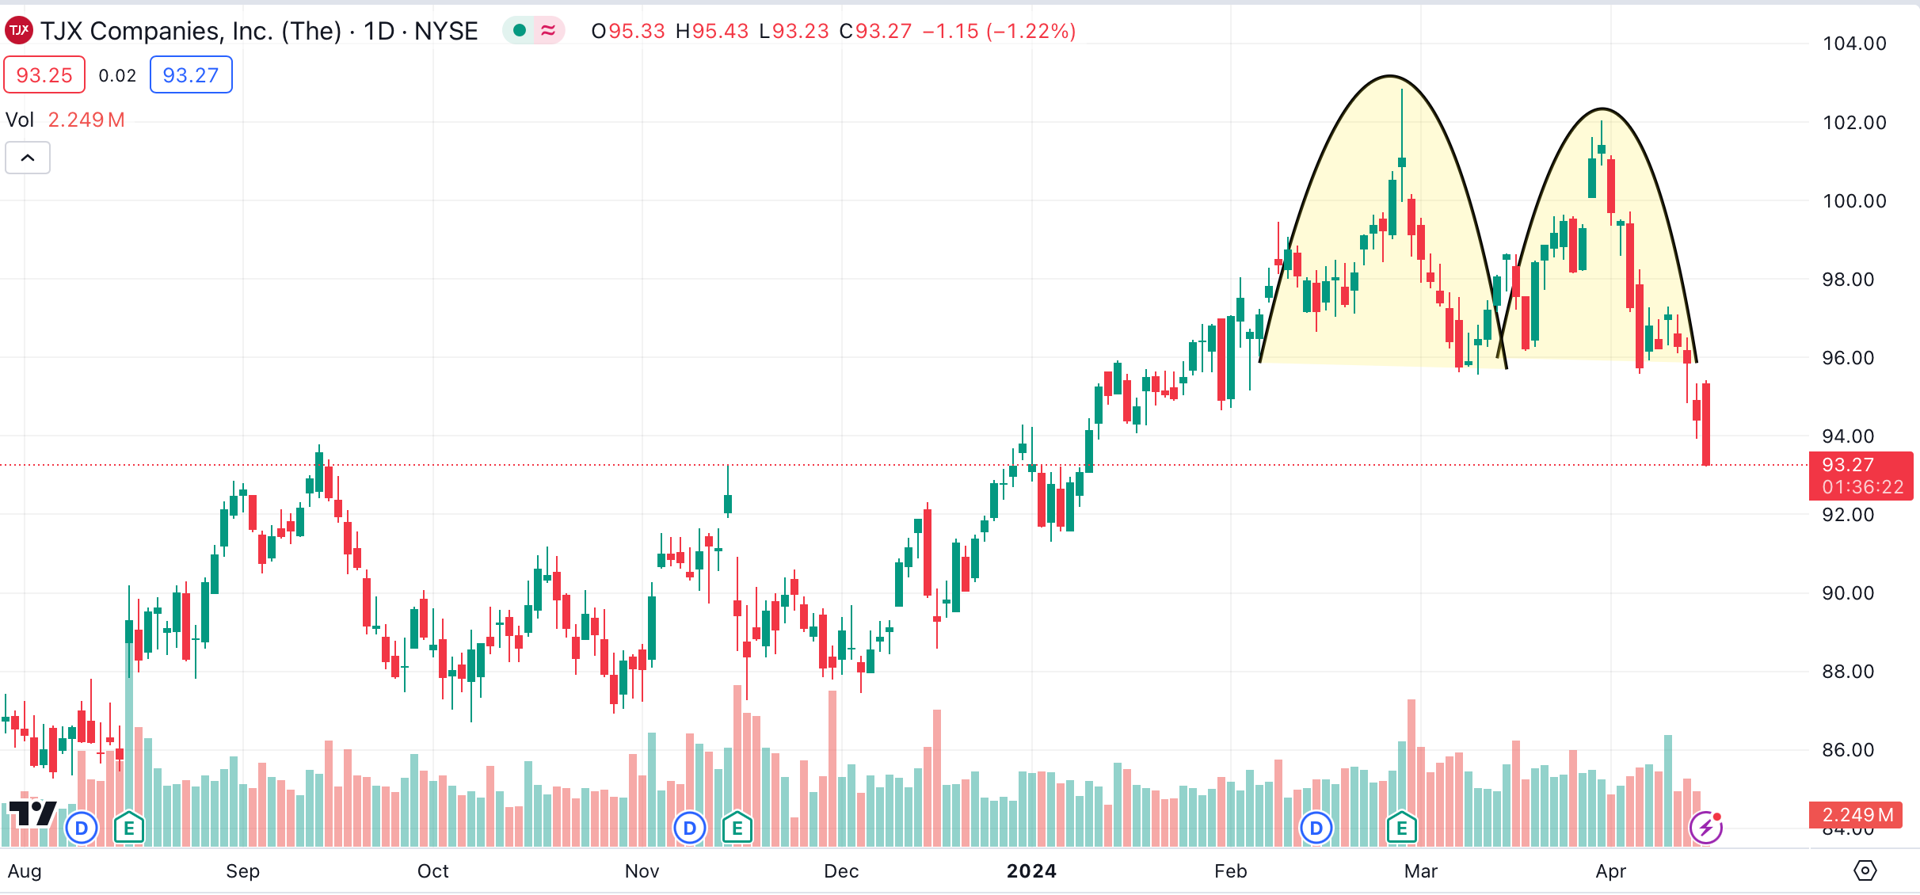
TJX Companies TJX has broken down from a double top (shaded yellow). The retailer saw a strong holiday season, but provided weak forward guidance during a late February conference call.
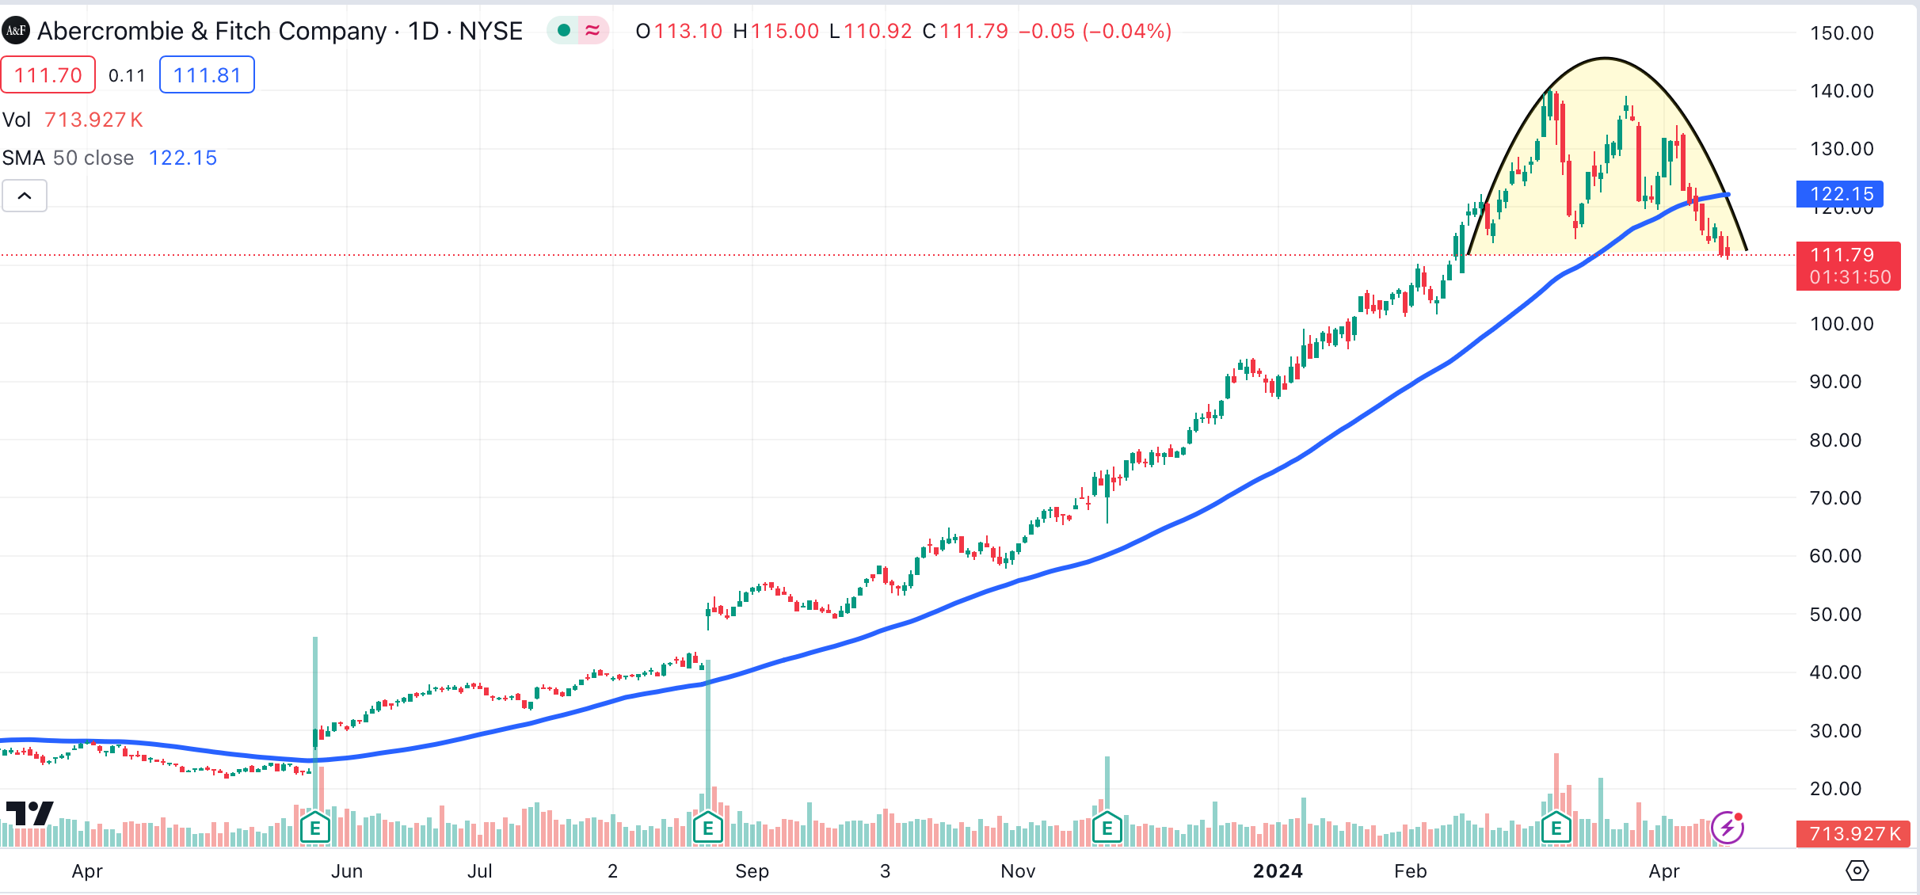
Another retailer, Abercrombie & Fitch ANF, recently broke down from a triple top (shaded yellow). The stock is trading below its 50-day MA (blue) after spending nearly two years above that indicator.
If these bearish patterns were contained within the retail space, they’d be less of a concern.
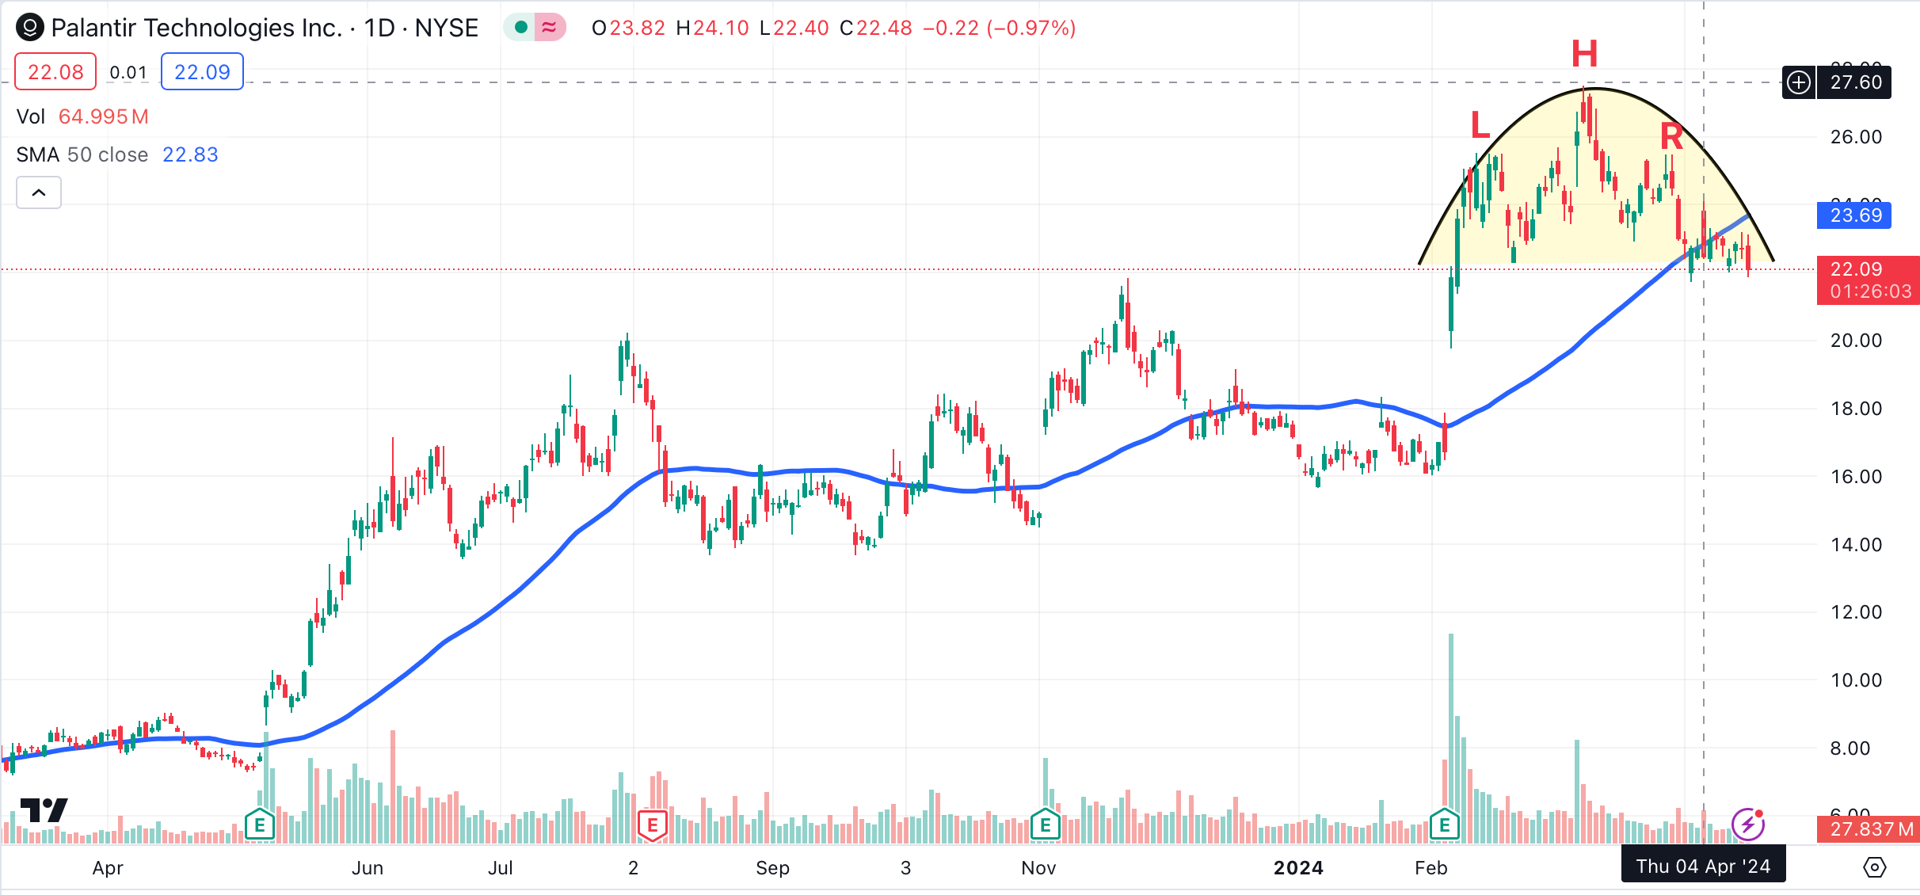
However, we see similar patterns developing in the tech space. For example, tech darling Palantir Technologies PLTR has formed a head-and-shoulder pattern (L-H-R) over the past two months.
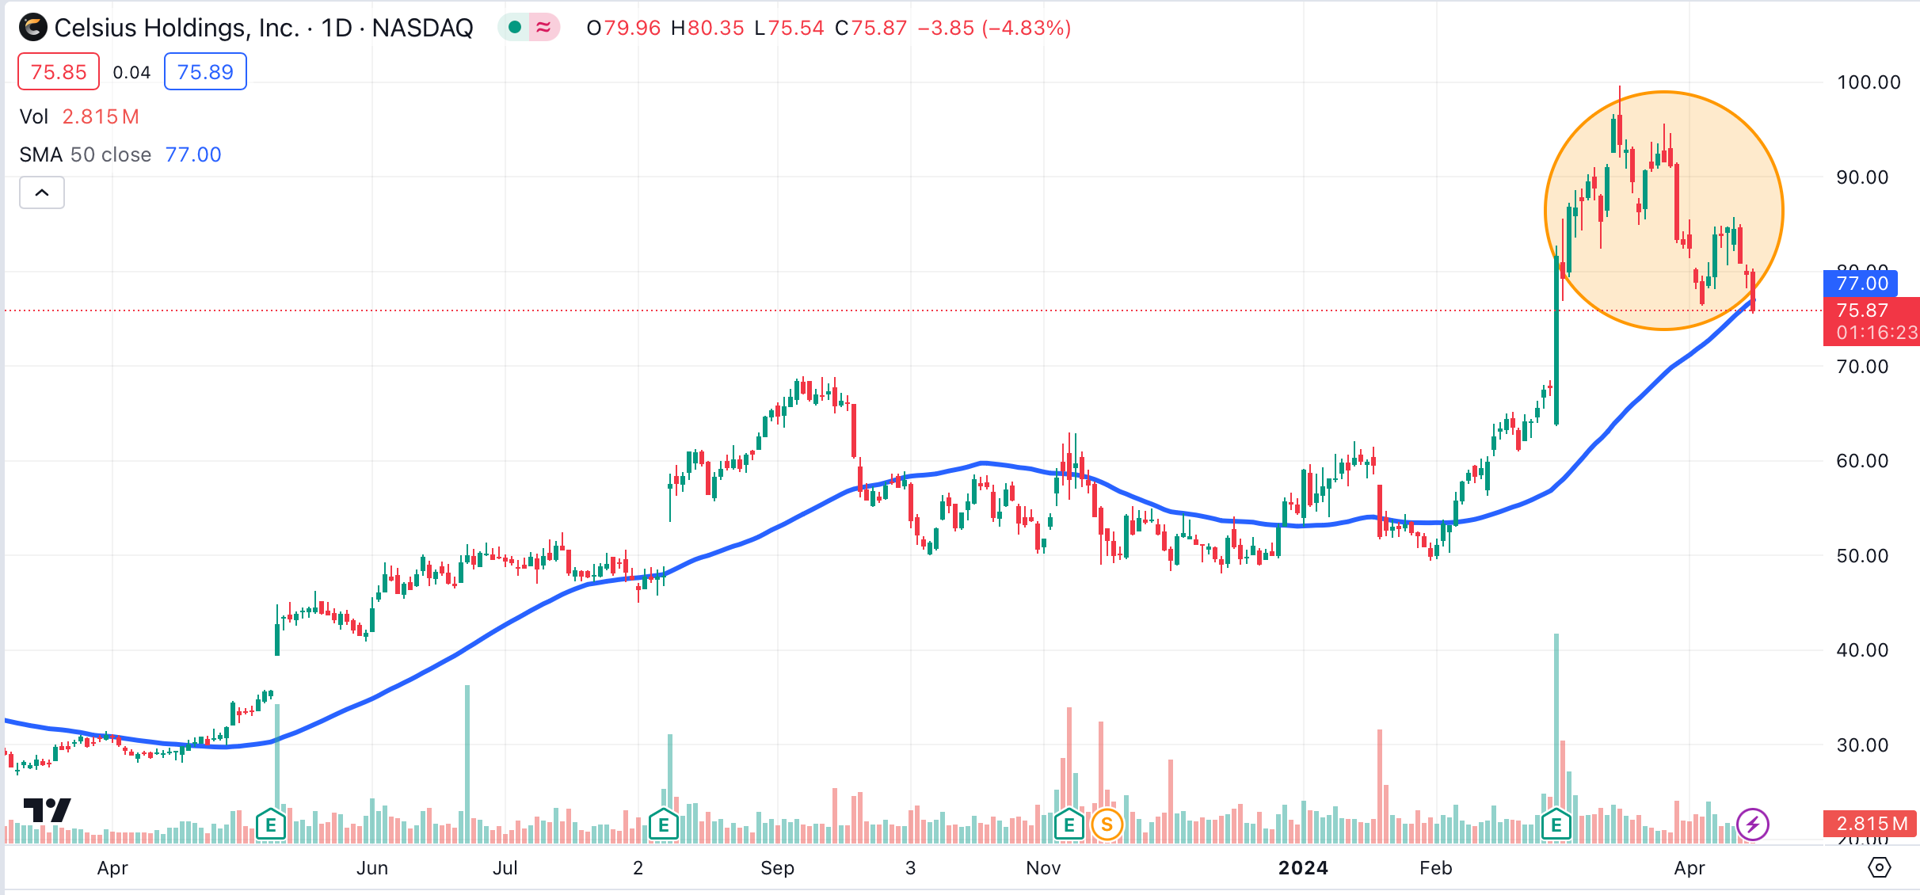
Beverage manufacturer Celsius Holdings CELH is also experiencing a breakdown from a topping pattern (shaded orange).
Should investors panic over these pockets of weakness? Absolutely not, but it’s important to understand that cracks are appearing in a variety of places. This has been a very forgiving market since a huge rally began in late October. Markets were due for a pullback, and now it's upon us.
At the time of publication, Ponsi had no positions in any securities mentioned.