Here’s Where Stocks Are Headed Next
Higher bond yields tend to pull money away from stocks. Let's look at the likely path for equities going forward.
You've reached your free article limit
You've read 0 of 1 free Pro articles.
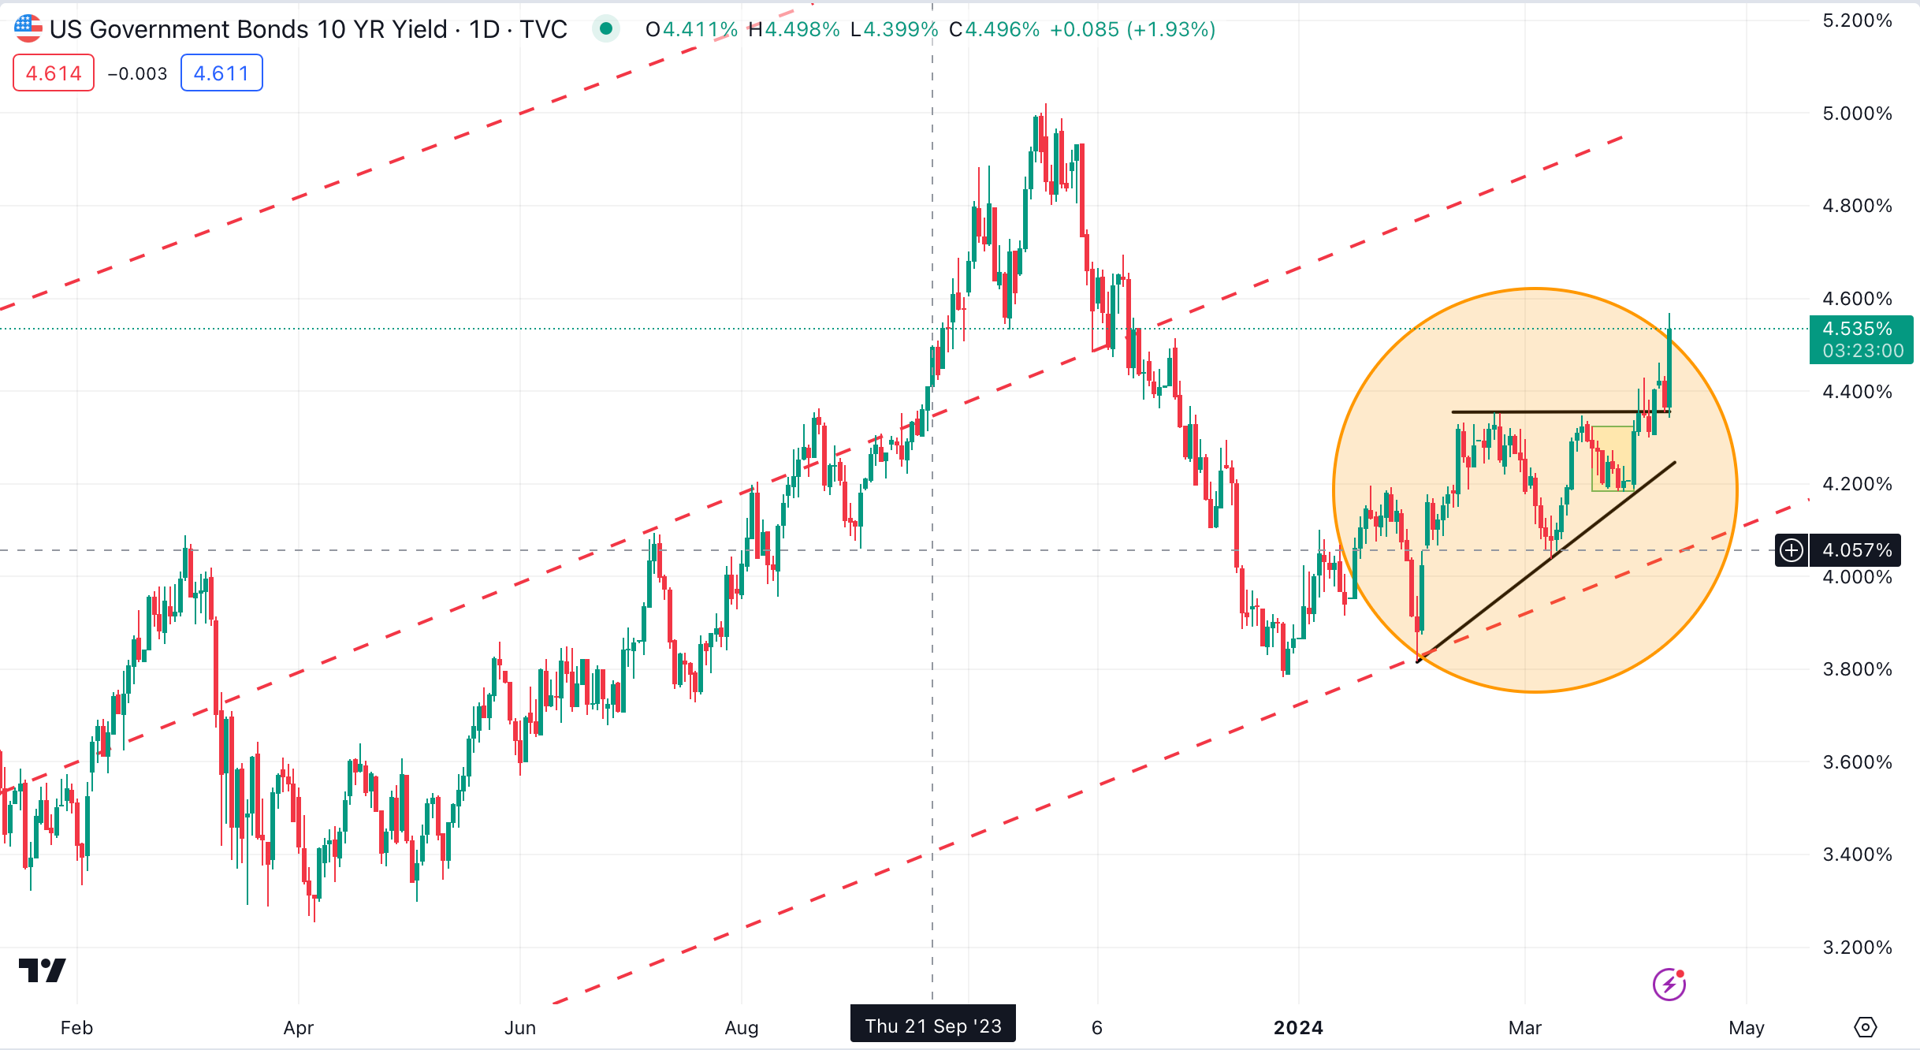
Last week, we alerted investors to watch a key level for the 10-Year U.S. Treasury note. Since then, the 4.35% yield level has been tested repeatedly. Each test ultimately failed, until Wednesday’s CPI report removed all doubt that the battle against inflation is far from over.
The report showed CPI inflation accelerating from 3.2% to a 3.5% annual rate. Inflation at the core level, which doesn’t include food and energy prices, remained constant at an elevated 3.8% level.
This news caused the 10-Year note’s yield to jump to 4.5%. A poorly received 10-Year Treasury auction proved to be the final straw, pushing the yield to 4.56%, a five-month high.
The charts contained all the necessary information to see this move coming. For the past few years, the 10-Year’s yield has traded in a channel (red dotted lines), indicating a bullish trend.
Within that channel, another bullish formation, known as an ascending triangle (orange circle), hinted at a move higher. After a few false starts, that move occurred with authority.
Higher bond yields tend to pull money away from stocks. We saw evidence of that on Wednesday, as the S&P 500 dropped by nearly 1%.
While a bullish pattern formed on a benchmark bond yield, a bearish pattern formed on a benchmark stock index. That pattern is taking shape on the daily chart of the S&P 500, which has formed a small rounded top (shaded yellow).
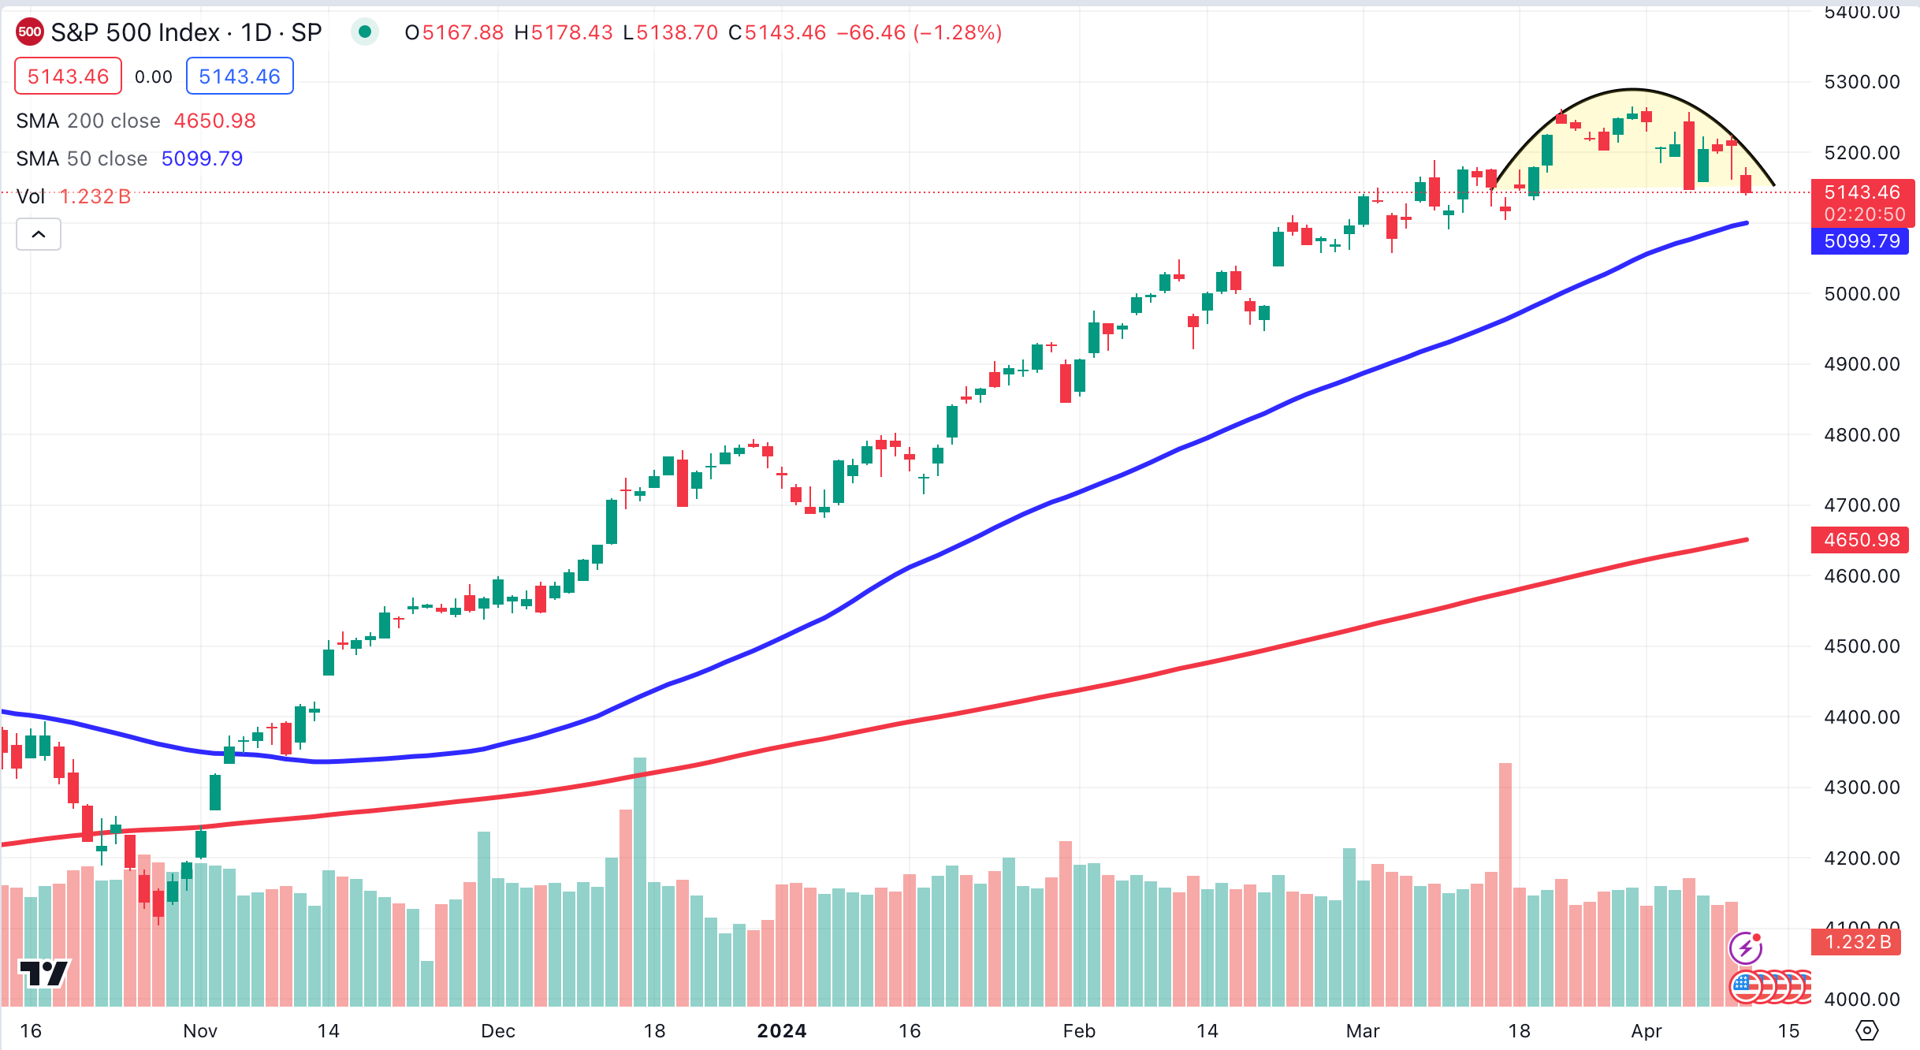
In the short term, the path of least resistance for the large-cap index appears to be lower. Since the pattern is small, I’m only expecting a pullback to the 5000-5100 area.
This means the S&P 500 could fall below its 50-day moving average (blue), currently located near 5100. The large-cap index hasn’t traded below that key indicator since November of last year.
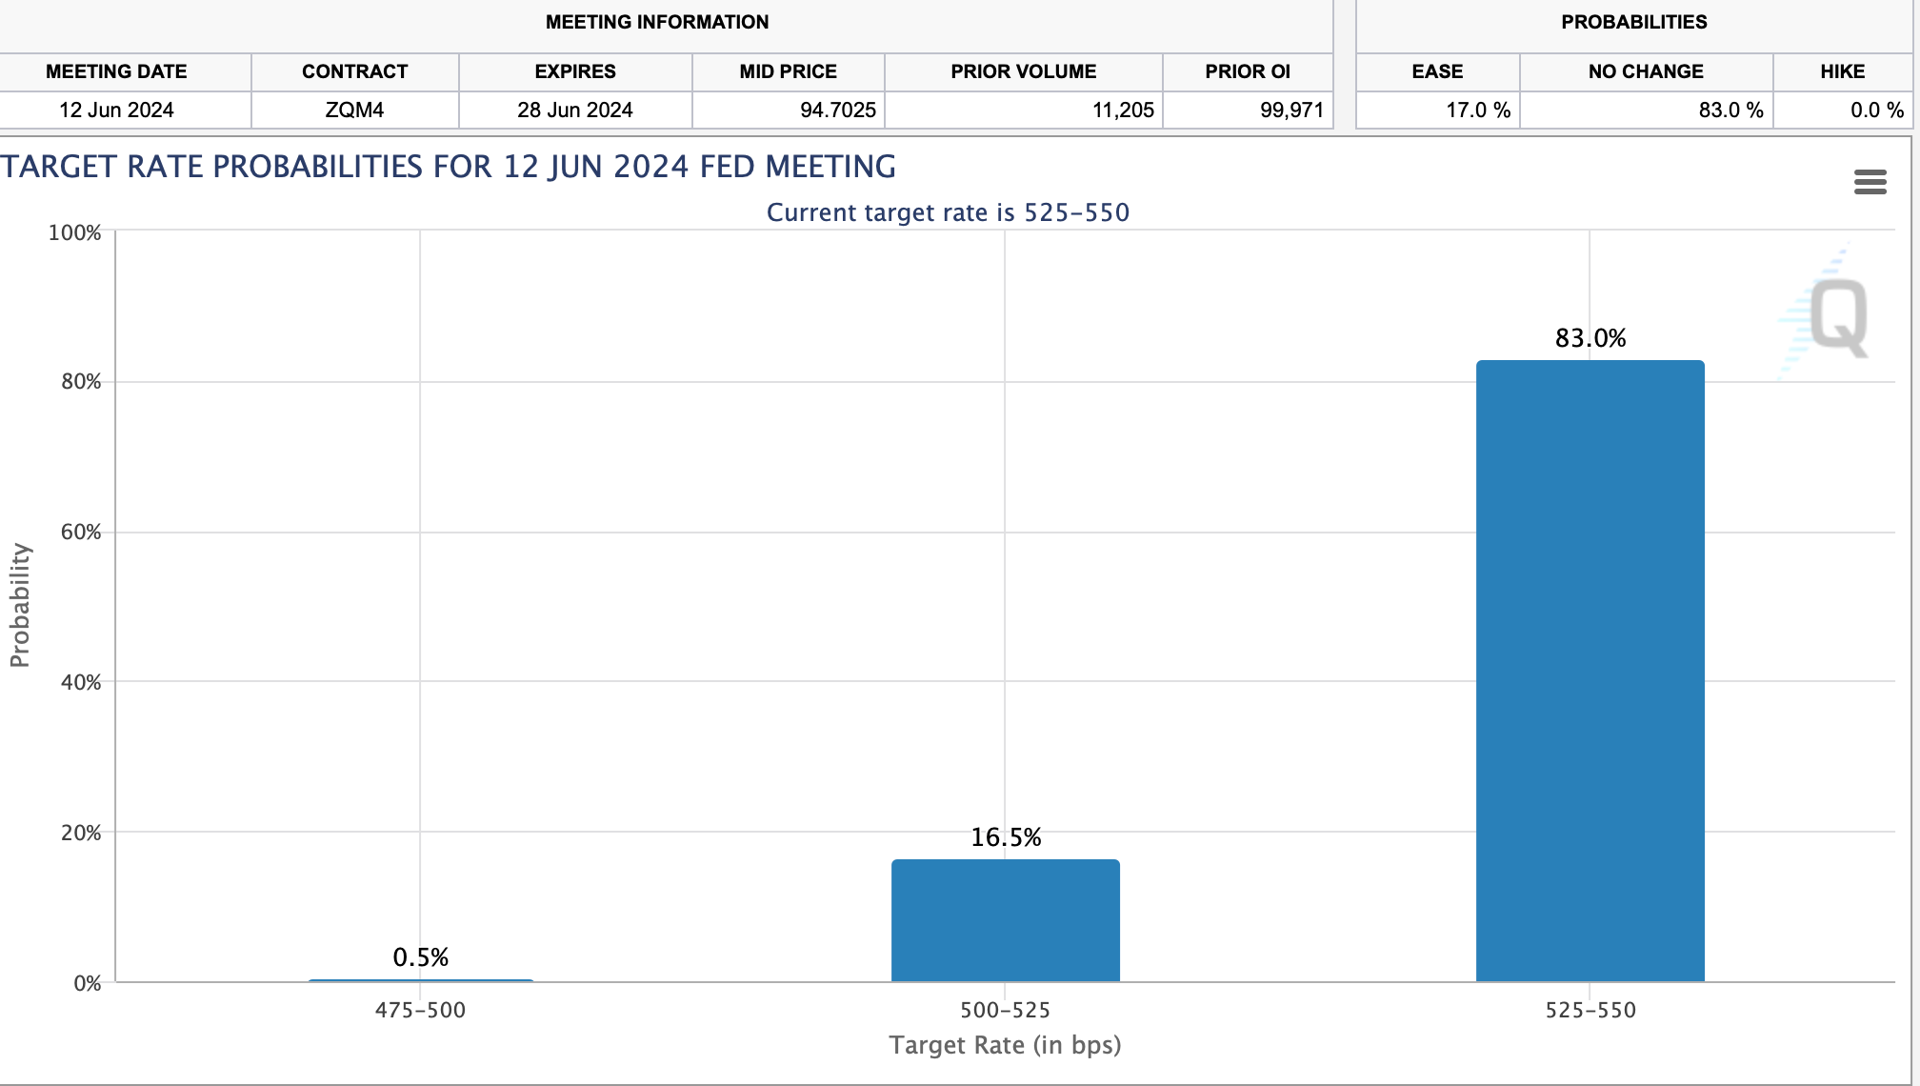
The CPI report has ended hopes for a June rate cut. According to the CME’s FedWatch Tool, the odds of a June rate cut have dropped to 17%.
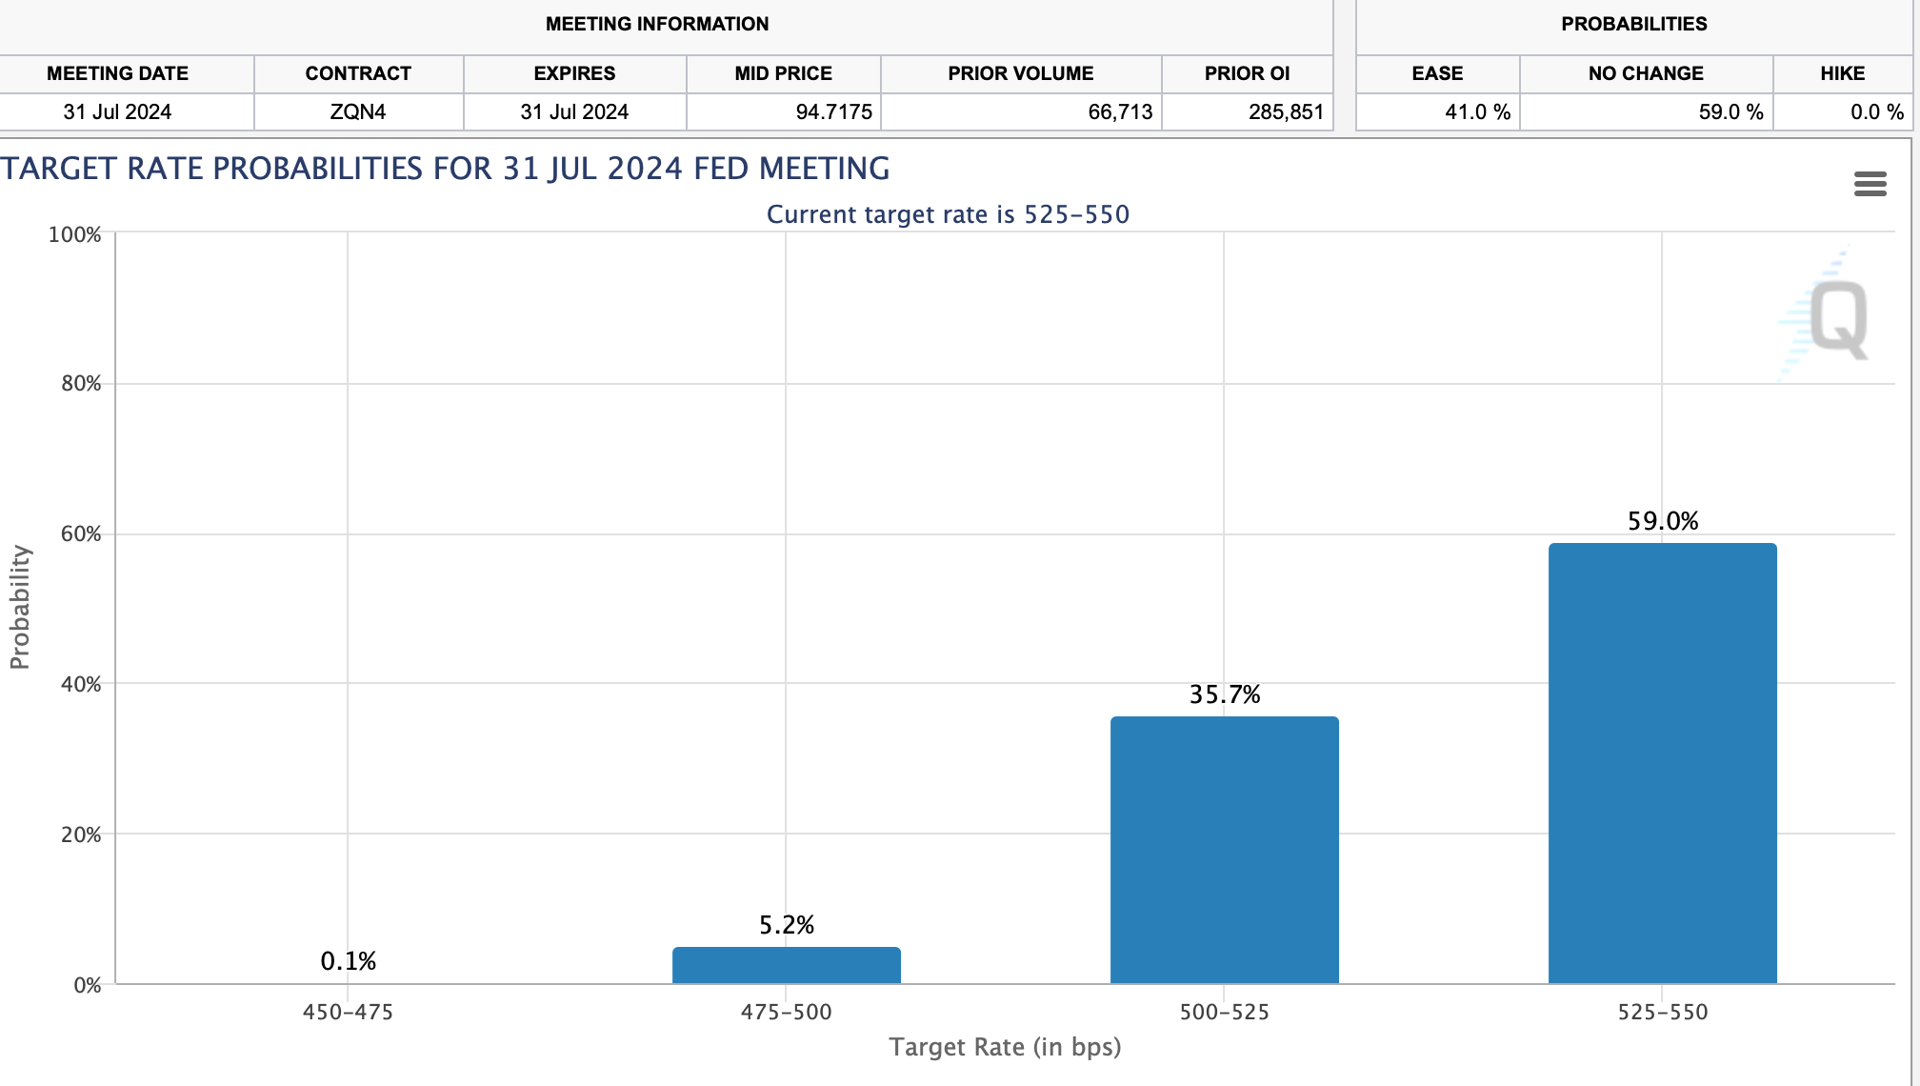
Rate-cut expectations for July have dropped to 41%.
Has the FOMC underestimated inflation? Yes, but higher rates for longer should resolve that issue.
I’m more concerned about Wednesday’s 10-Year auction. One bad auction can be considered an anomaly, but a series of them could create a new narrative. The next 10 Year note auction is scheduled for May 1, and investors should watch it closely.
At the time of publication, Ponsi had no positions in any securities mentioned.