Key Level for Treasuries Is Back in Focus
The yield on the 10-Year Treasury note surged Monday. Don’t be surprised if it moves higher.
You've reached your free article limit
You've read 0 of 1 free Pro articles.
Treasury yields shot higher on Monday, as investors digested comments from Fed Chair Powell. Those comments may have caught investors off guard, as they were given on Friday, while U.S. stock markets were closed.
“We don’t need to be in a hurry to cut,” said Powell at a conference in San Francisco. “We can wait and become more confident that, in fact, inflation is coming down to 2% on a sustainable basis.”
As a result, the yield on the benchmark 10-Year Treasury note shot higher on Monday, by 13 basis points, from 4.20% to 4.33%. The move created a massive bullish engulfing candle on the 10-Year’s chart.
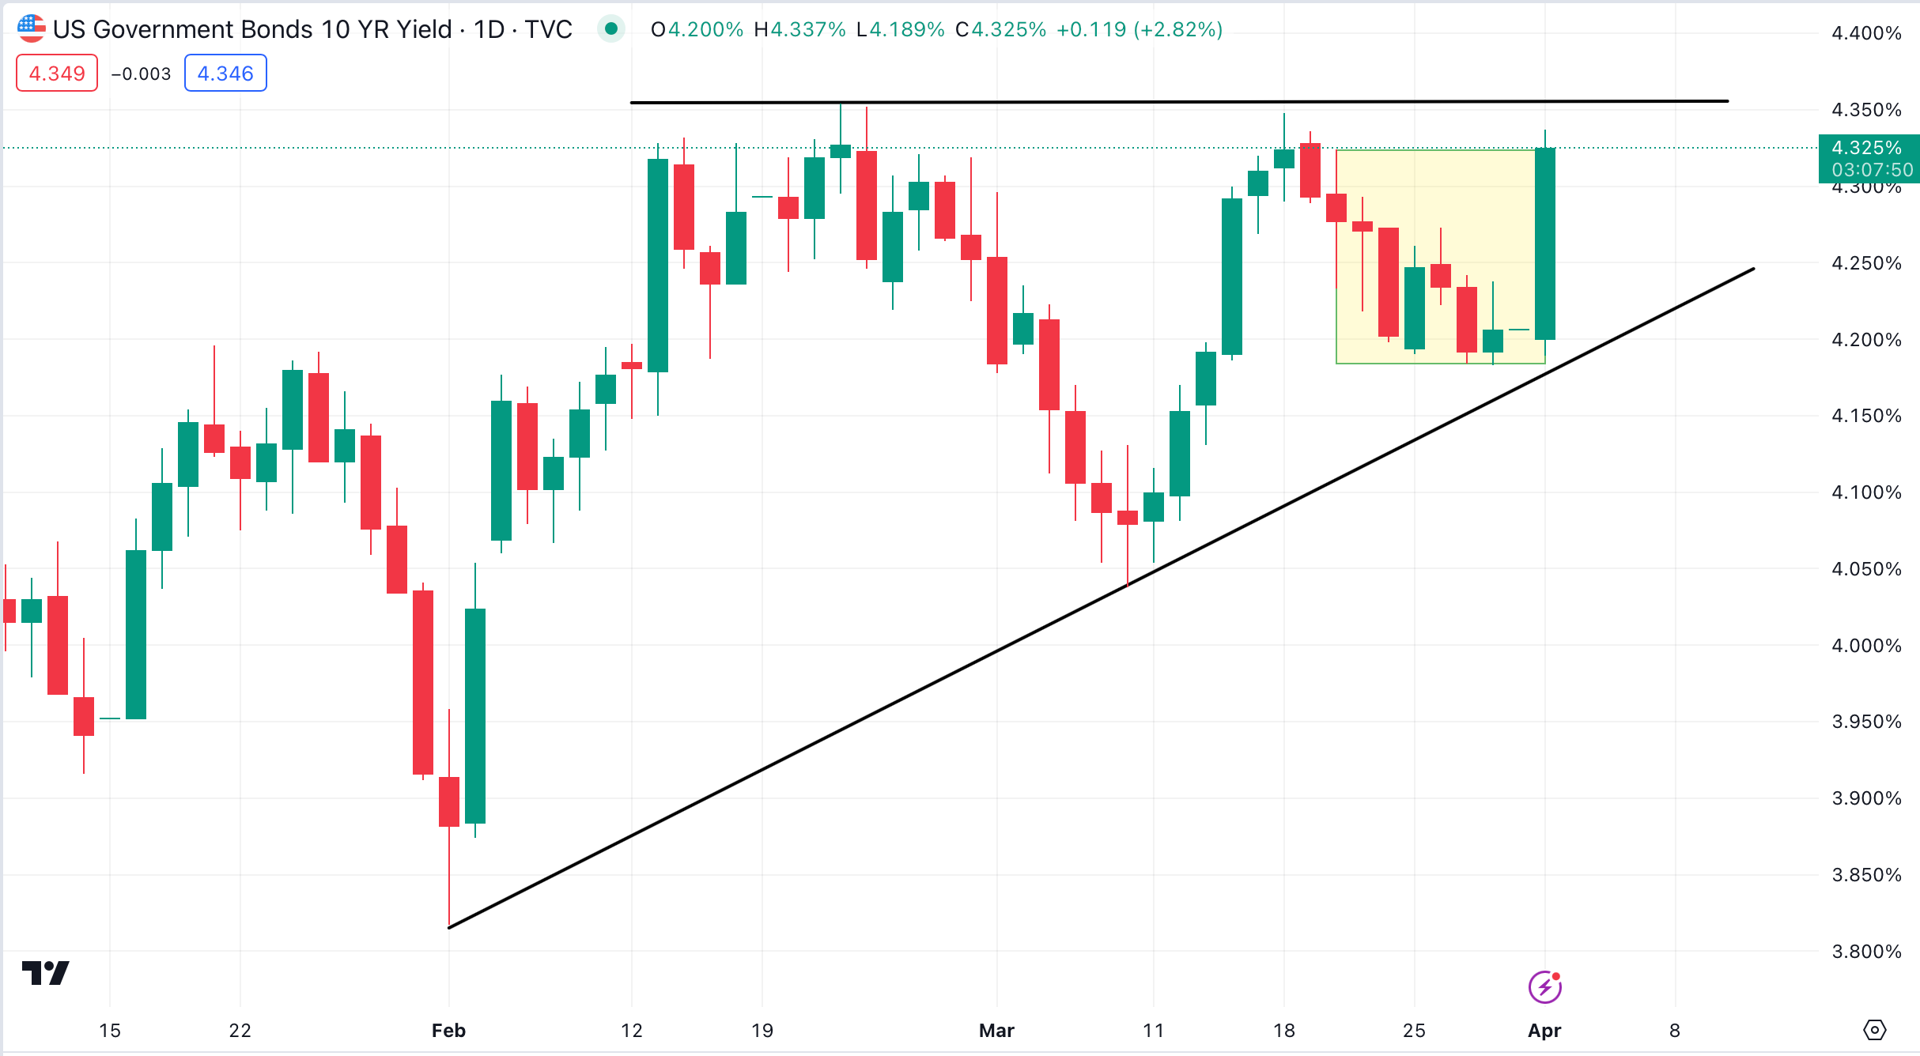
The candle engulfed all price activity since March 20 (shaded yellow), essentially rendering those candles meaningless. It also pushed the yield to a tough resistance level that has held its ground on numerous occasions this year.
Those tests of resistance, combined with a short-term bullish trendline, have created a pattern known as an ascending triangle (black lines). The bullish pattern suggests that the 10-Year note could yield as much as 4.55% in the near future.
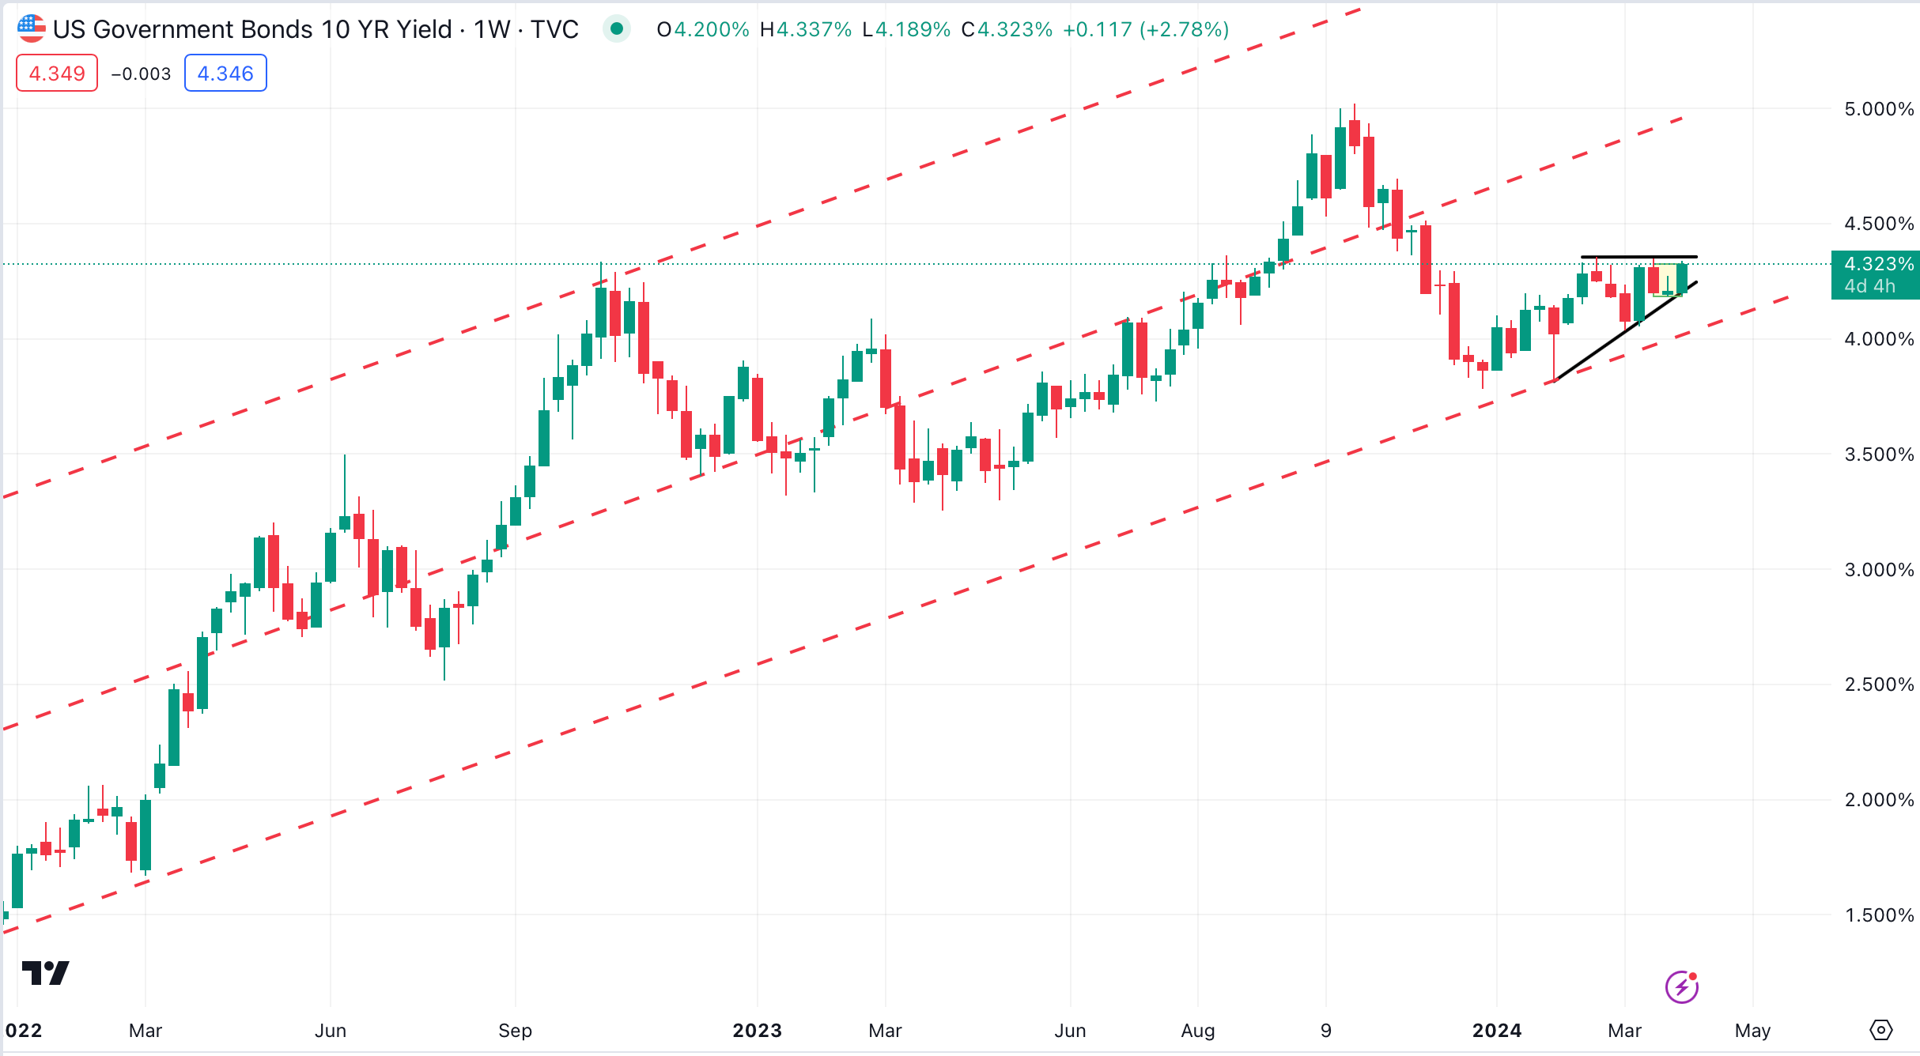
Now, let’s zoom out to the weekly chart for context. The bullish ascending triangle (black lines), a short-term pattern, exists within a long-term bullish channel, extending back to early 2022. Don’t be surprised if yields move higher.
There are plenty of reasons to be skeptical about near-term Fed rate cuts. One is the sudden, sharp increase in the Atlanta Fed’s GDPNow estimate for Q1 GDP growth.
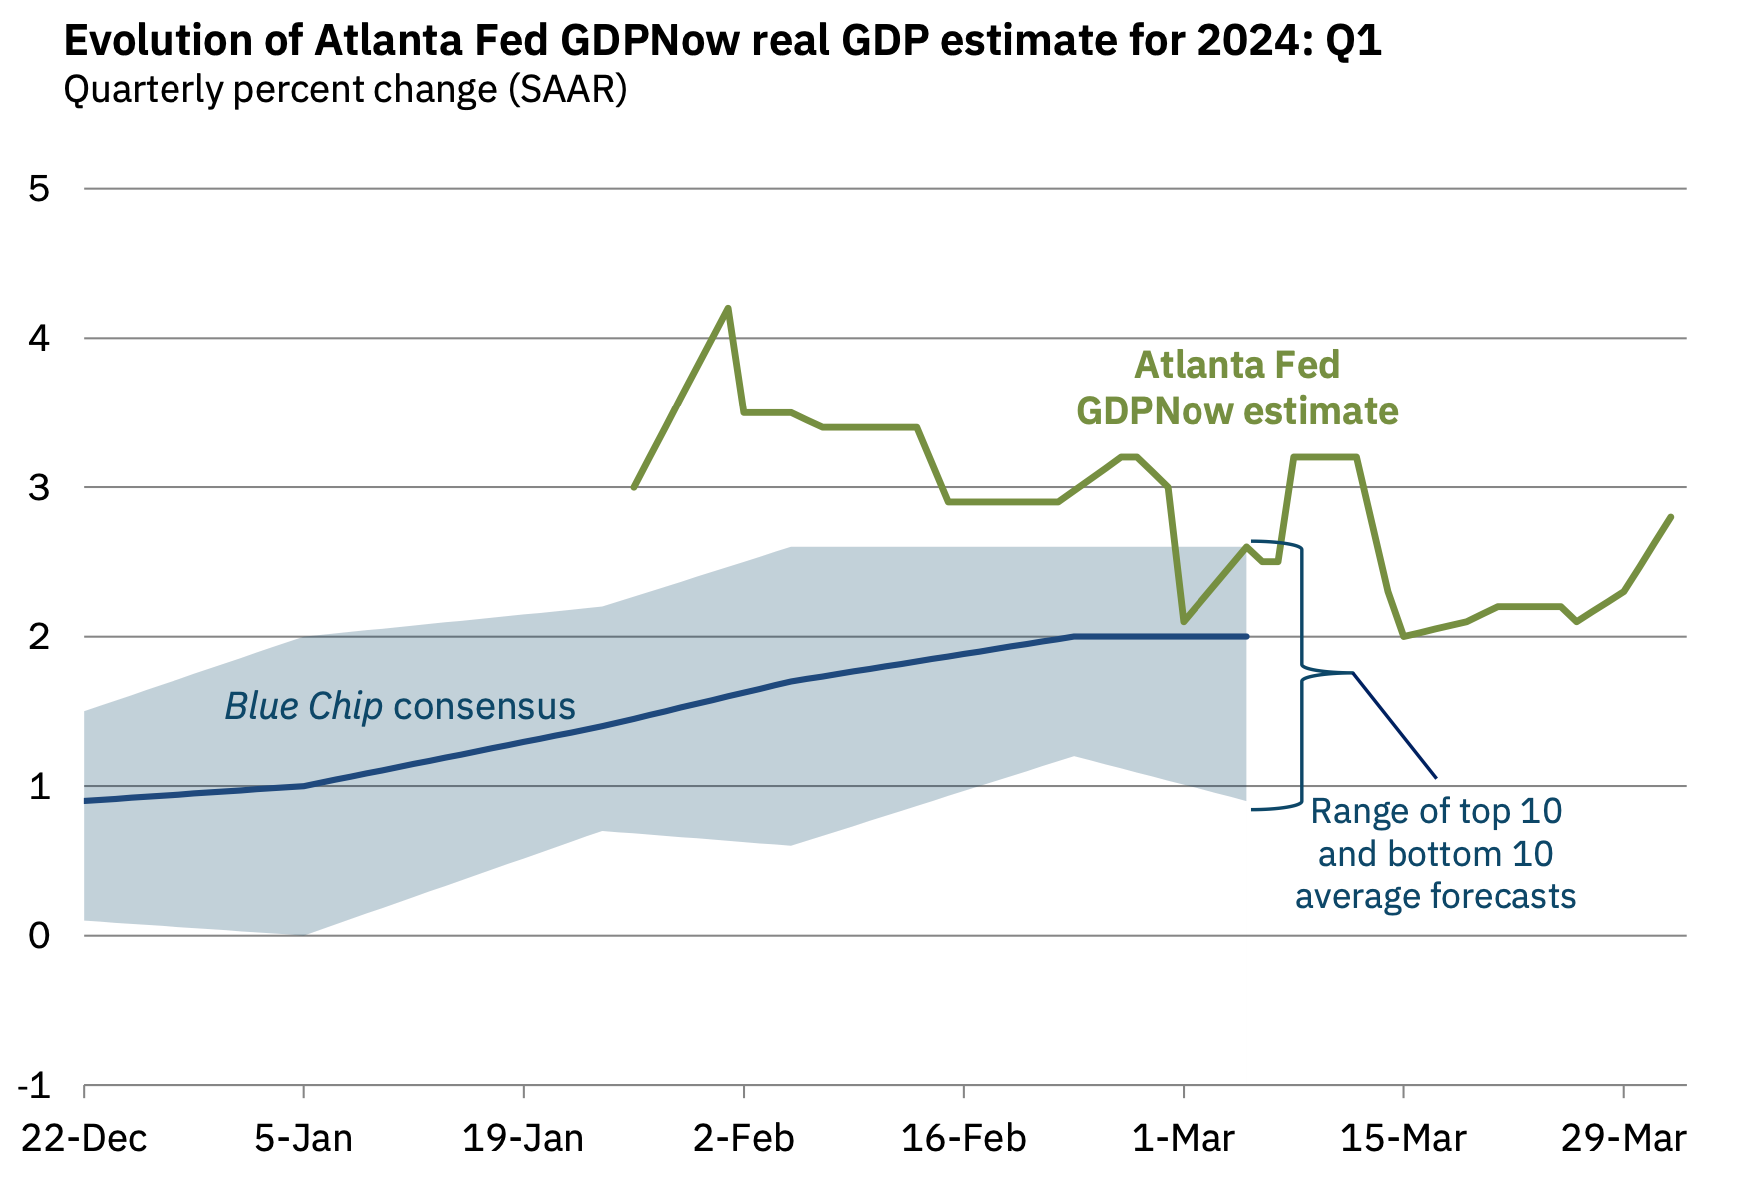
That GDP estimate surged from 2.3% on March 29 to 2.8% on April 1 (green line). The estimate for real personal consumption expenditures growth jumped from 2.6% to 3.1%, and the real gross private domestic growth estimate climbed from 3.2% to 3.9%.
Monday’s stats from the Institute of Supply Management also played a role in the 10-Year note’s yield surge. The ISM Manufacturing index climbed above 50 for the first time since November 2022. Any reading above 50 represents growth.
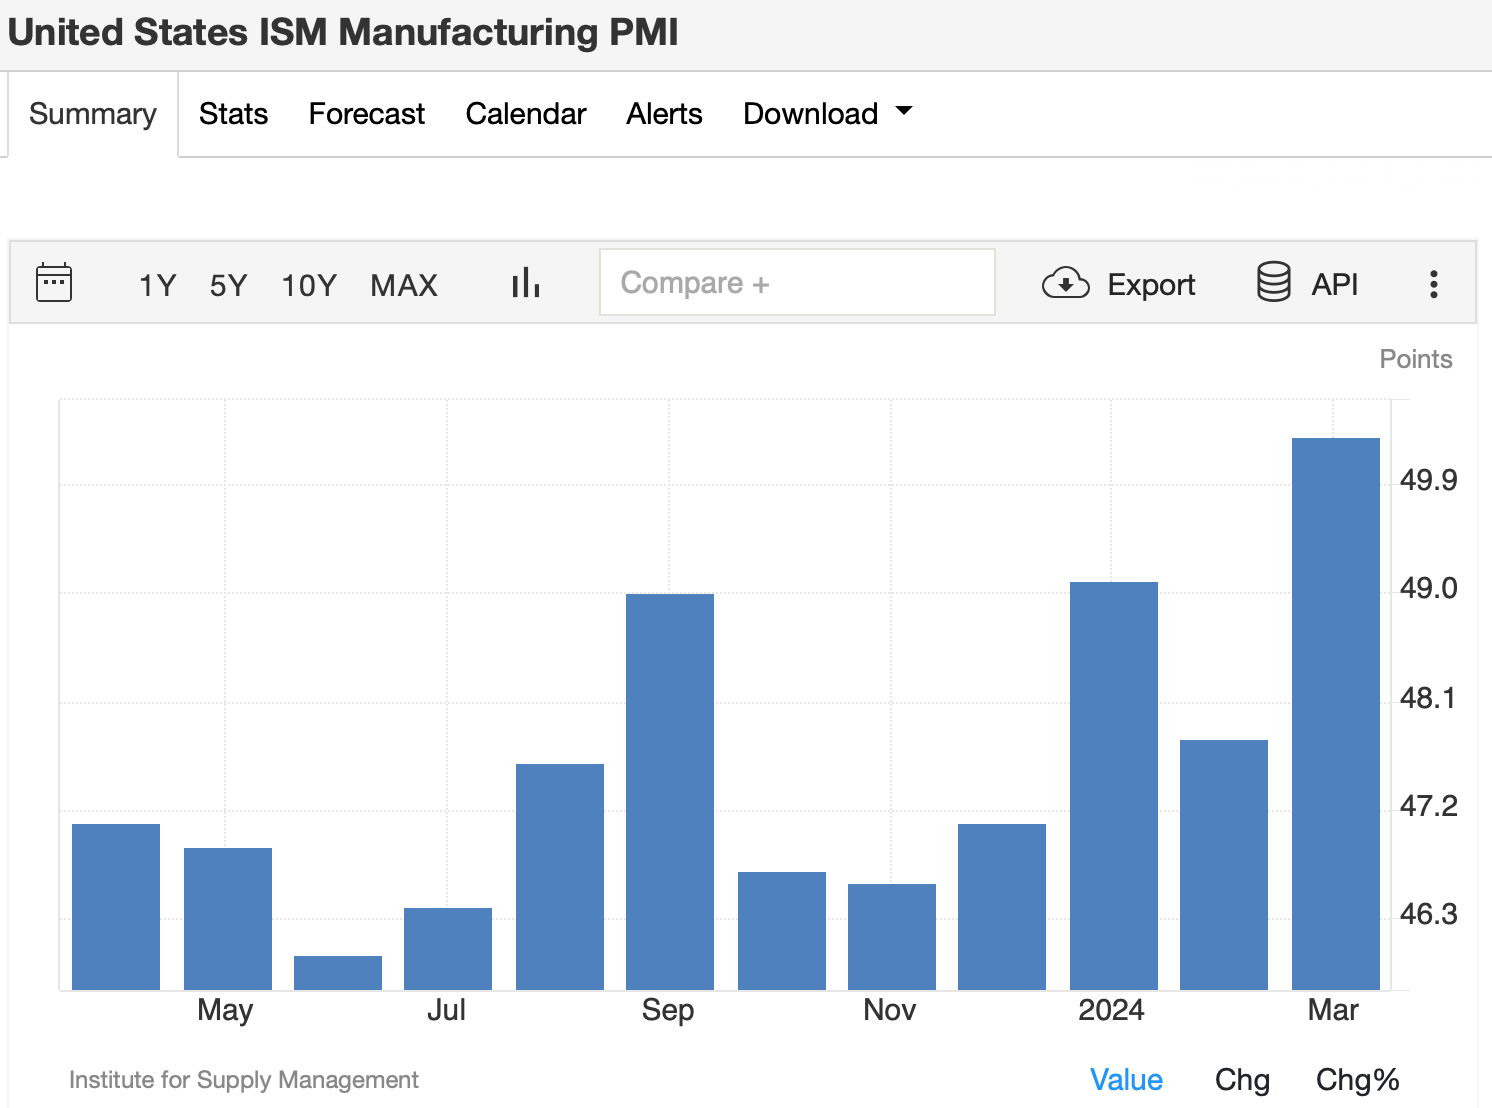
Within that index is a measure of inflation called the ISM Prices Paid component. That figure shot above 55 for the first time since August 2022.
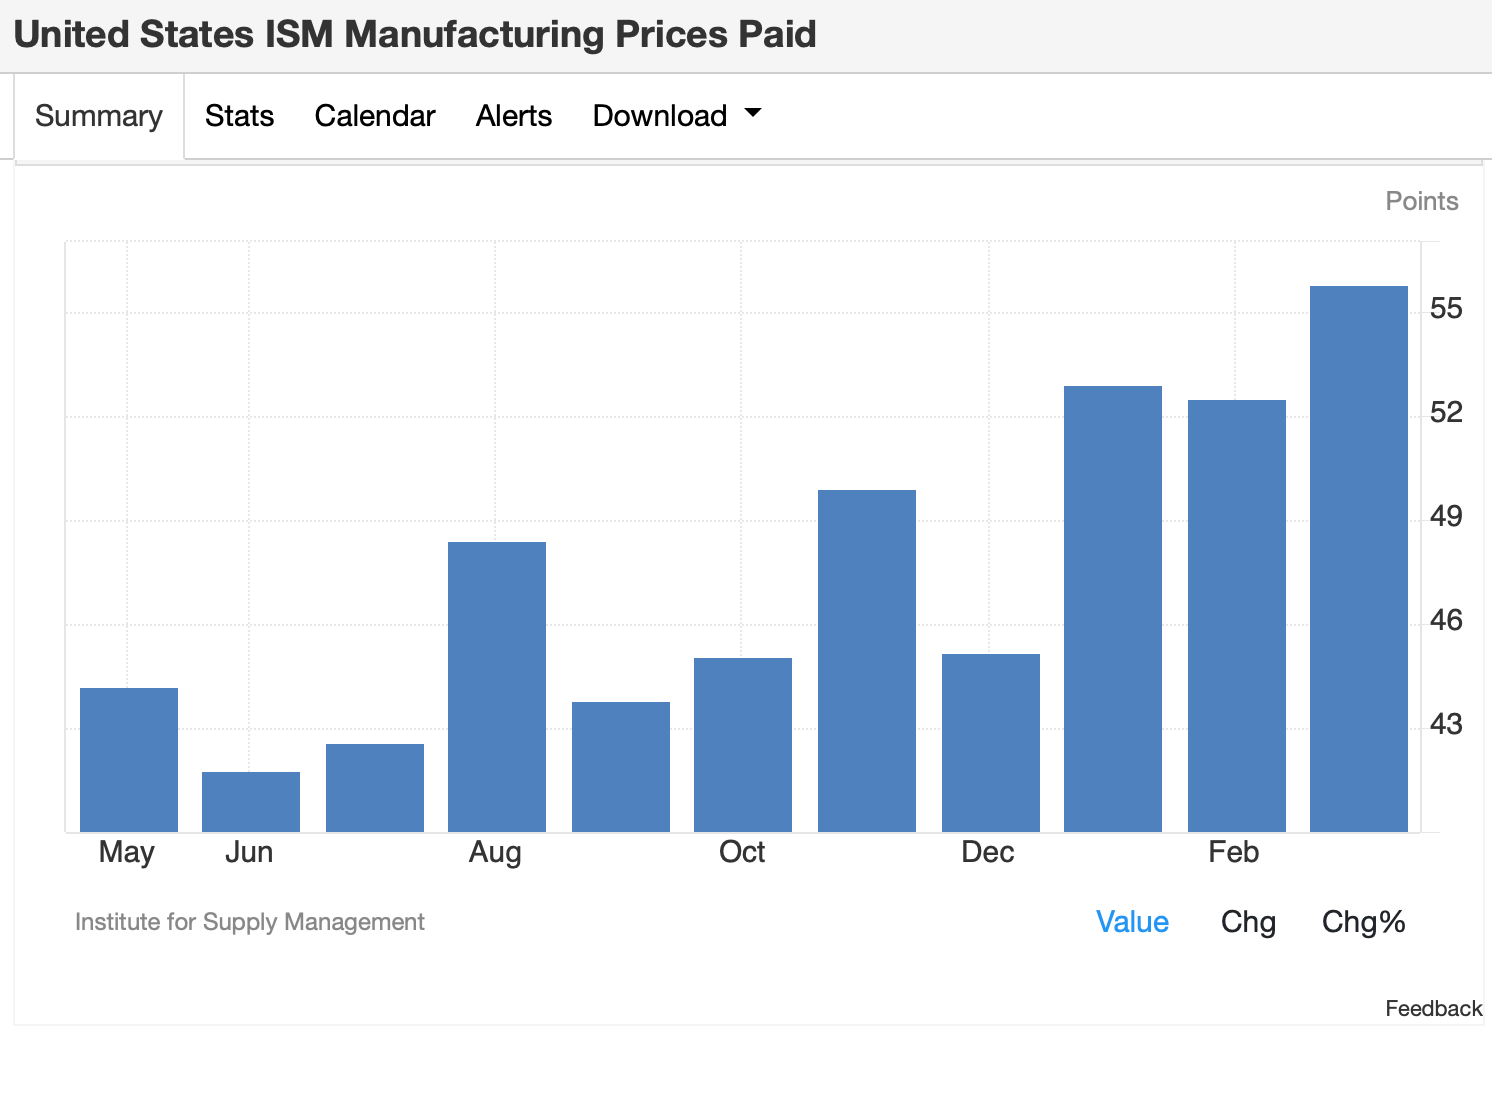
What does it all mean? Simply put, growth could be accelerating. Also, despite some recent favorable readings, inflation hasn’t been defeated.
As usual, the Fed is data-dependent. All it took was a few day’s worth of data to send yields soaring. I’ll be watching that 4.35% level, as a clean break could impact our targets for gold ($2,325) and the S&P 500 (5,375).
At the time of publication, Ponsi was long gold.