If You Get Into Uber, Wear a Helmet and Go Slowly
Here's why it might be safe to buy this stock -- and when you can start to press on the accelerator.
You've reached your free article limit
You've read 0 of 1 free Pro articles.
Ride sharing and delivery company Uber Technologies UBER is in the news Wednesday after the company announced it hired a former Tesla TSLA executive to help with its electric vehicle transition. The stock price is not moving much in the premarket Wednesday, but let's take a 30,000-foot look at the charts and indicators. I was bearish on UBER in my June 3 update.
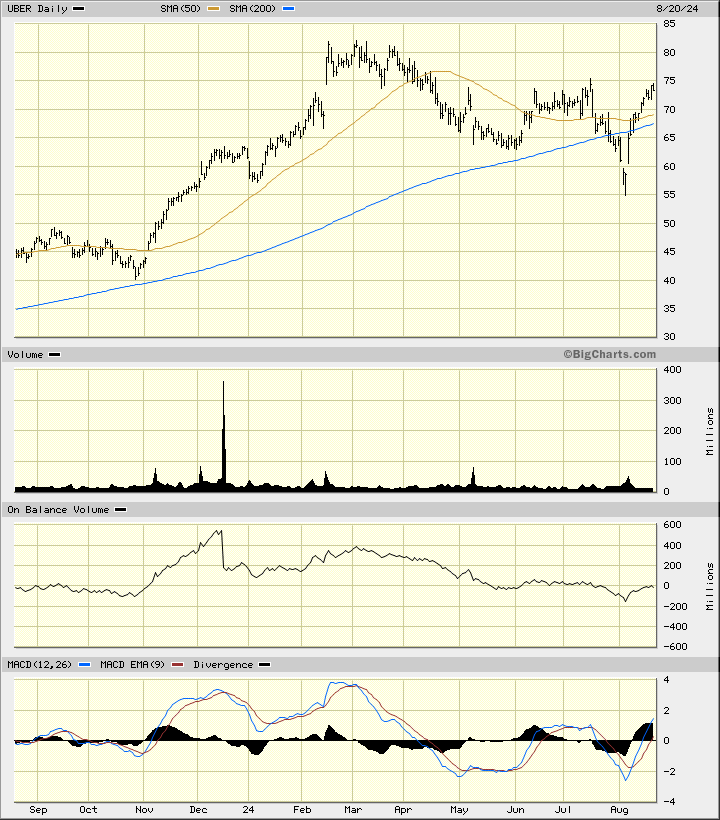
In this updated bar chart of UBER, below, I can see that prices briefly broke below the rising 200-day moving average line in July and early August. Prices have rebounded to the upside in recent days and now trade above both the 50-day line and the slower-to-react 200-day line.
The On-Balance-Volume (OBV) line has been in a declining phase since December and suggests the current rally is likely to run out of steam. The Moving Average Convergence Divergence (MACD) oscillator only recently moved above the zero-line for a buy signal.
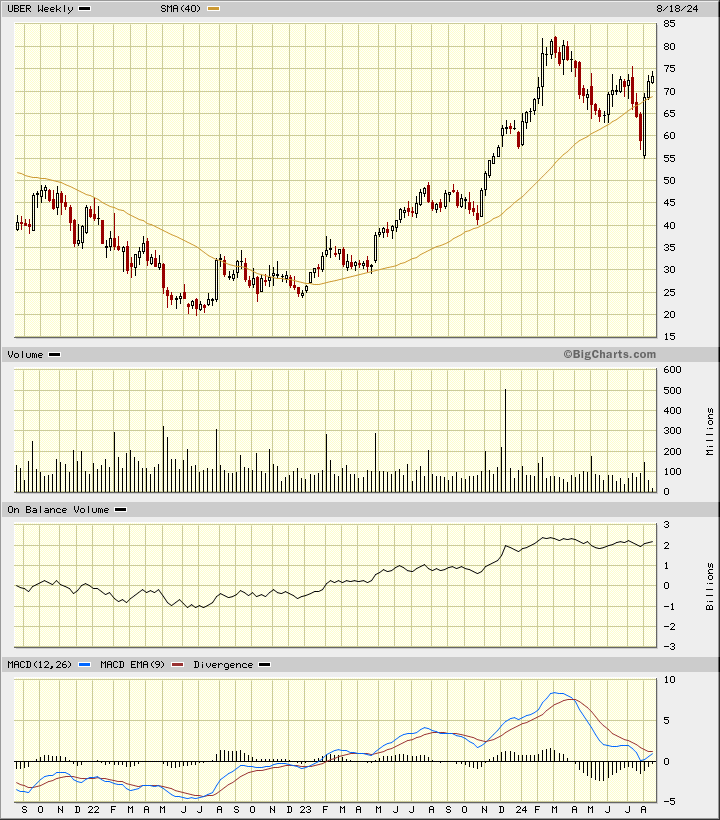
In this weekly Japanese candlestick chart of UBER, below, I see a more positive looking chart than what I saw in early June. Prices have rallied back above the rising 40-week moving average line. The weekly OBV line has firmed recently and the MACD oscillator is poised for an upside crossover and buy signal.
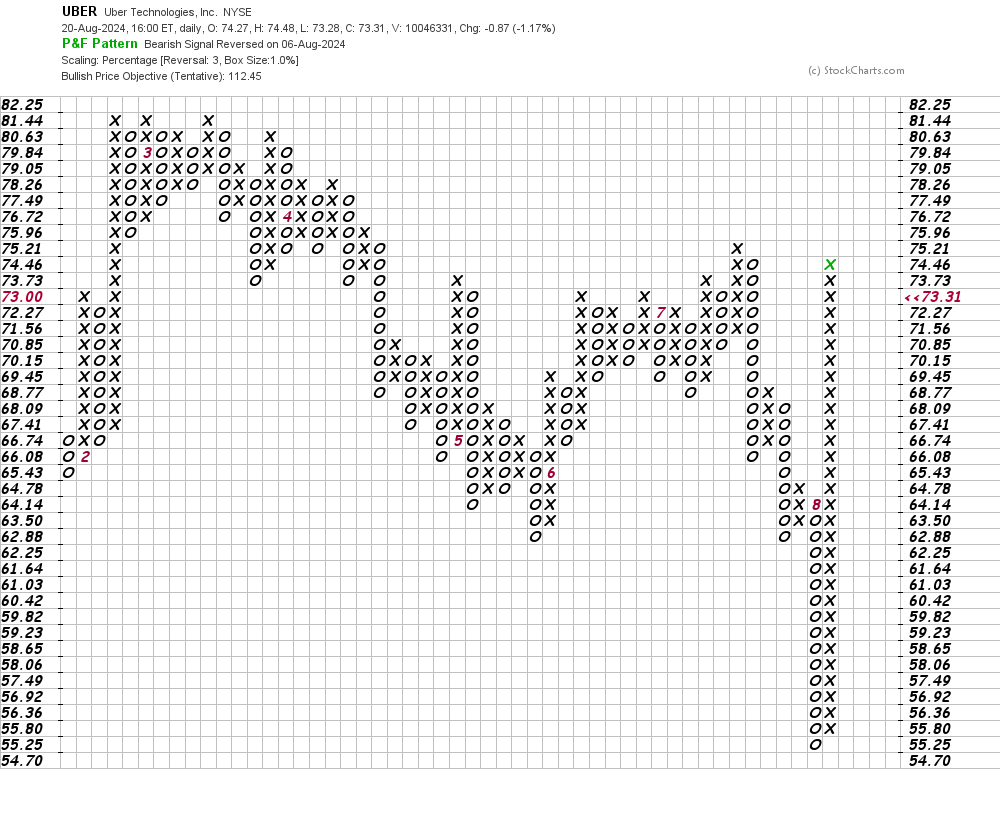
In this daily Point and Figure chart of UBER, below, I can see an upside price target in the $112 area.
In this weekly Point and Figure chart of UBER, below, I can see the same price target of $112 and here we can see that a trade at $82.25 will refresh the uptrend.
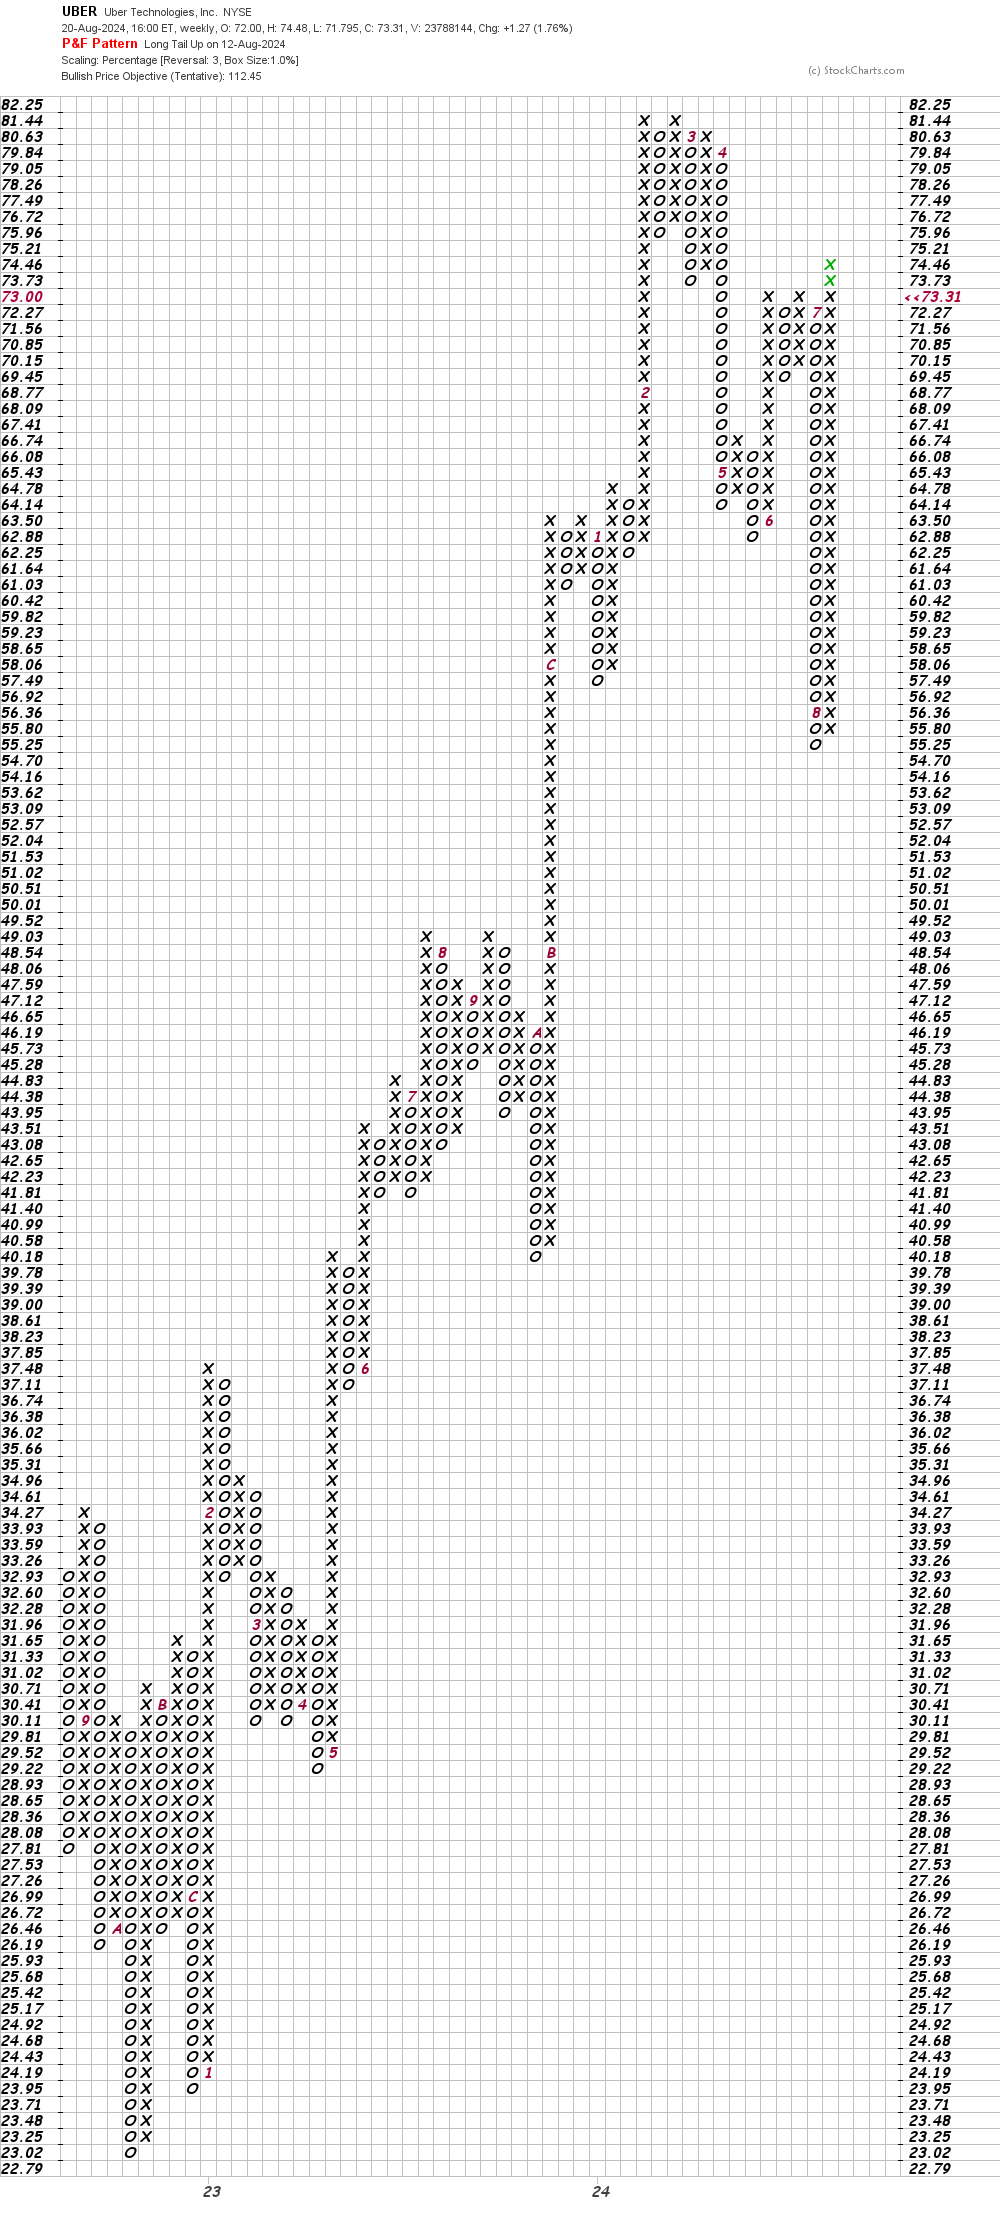
Bottom line strategy: Traders could go long UBER at current levels but not become aggressive buyers until UBER rallies above $82.25. Risk to $68. The $112 area is the price target for now.
Employees of TheStreet are prohibited from trading individual securities.