We've Got a New Downside Price Target for a Rideshare Giant
A close look at the daily and weekly charts for Lyft suggest weakness ahead.
You've reached your free article limit
You've read 0 of 1 free Pro articles.
Shares of ridesharing firm Lyft Inc. (LYFT) have weakened over the past two months. Let's check out the charts to see if this pullback can continue.
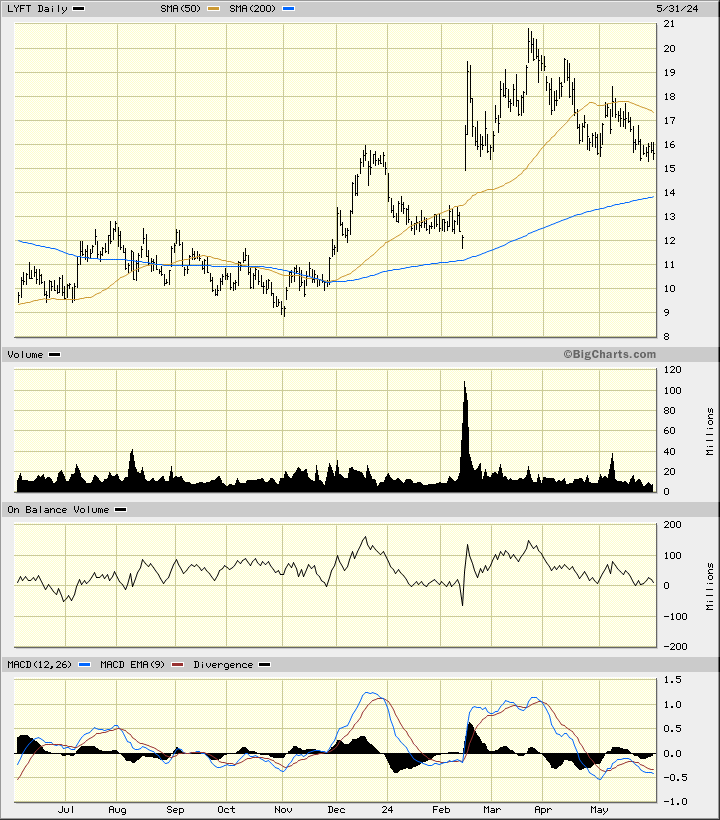
In this daily bar chart of LYFT below, I can see that prices are trading below the declining 50-day moving average line. The rising 200-day moving average line that intersects only a few dollars below the market is a potential price target for bears. The On-Balance-Volume (OBV) line has been weakening since late March and tells me that sellers of LYFT have been and are more aggressive than buyers of the stock. The Moving Average Convergence Divergence (MACD) oscillator is in a bearish alignment below the zero line.
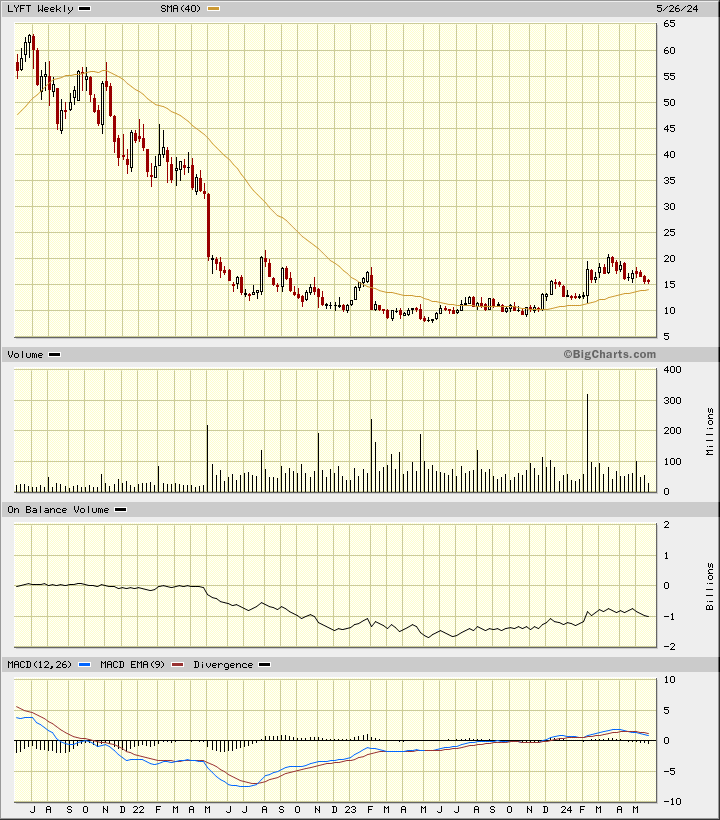
In this weekly Japanese candlestick chart of LYFT below, I see that shares of LYFT are pulling back or correcting to the downside within a bottoming pattern. Prices are slightly above the 40-week moving average line but that could change in the weeks ahead. The weekly OBV line is showing weakness in June. The MACD oscillator has been correcting lower since early April.
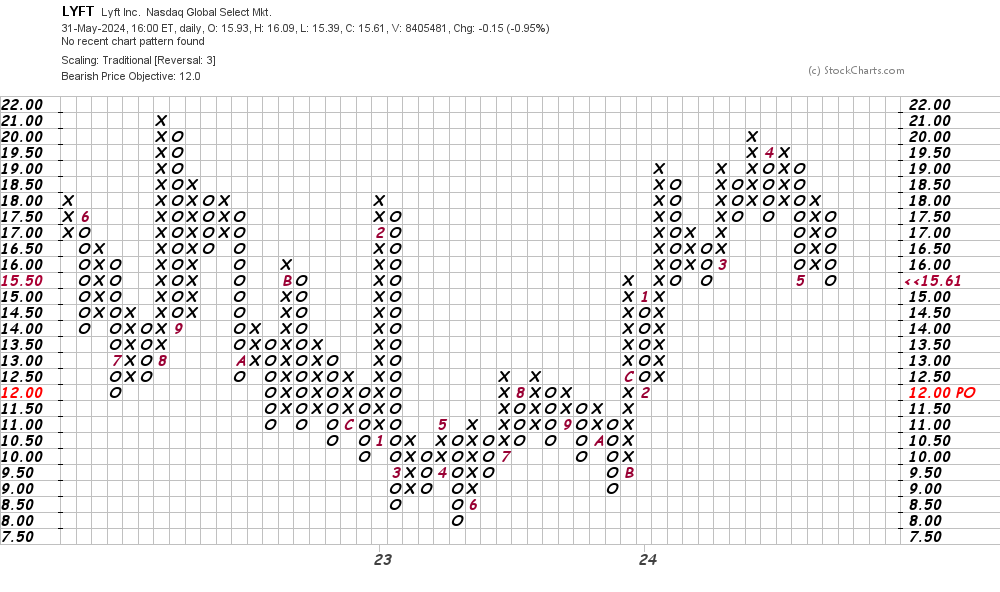
In this daily Point and Figure chart for LYFT below, I can see a potential downside price target in the $12 area.
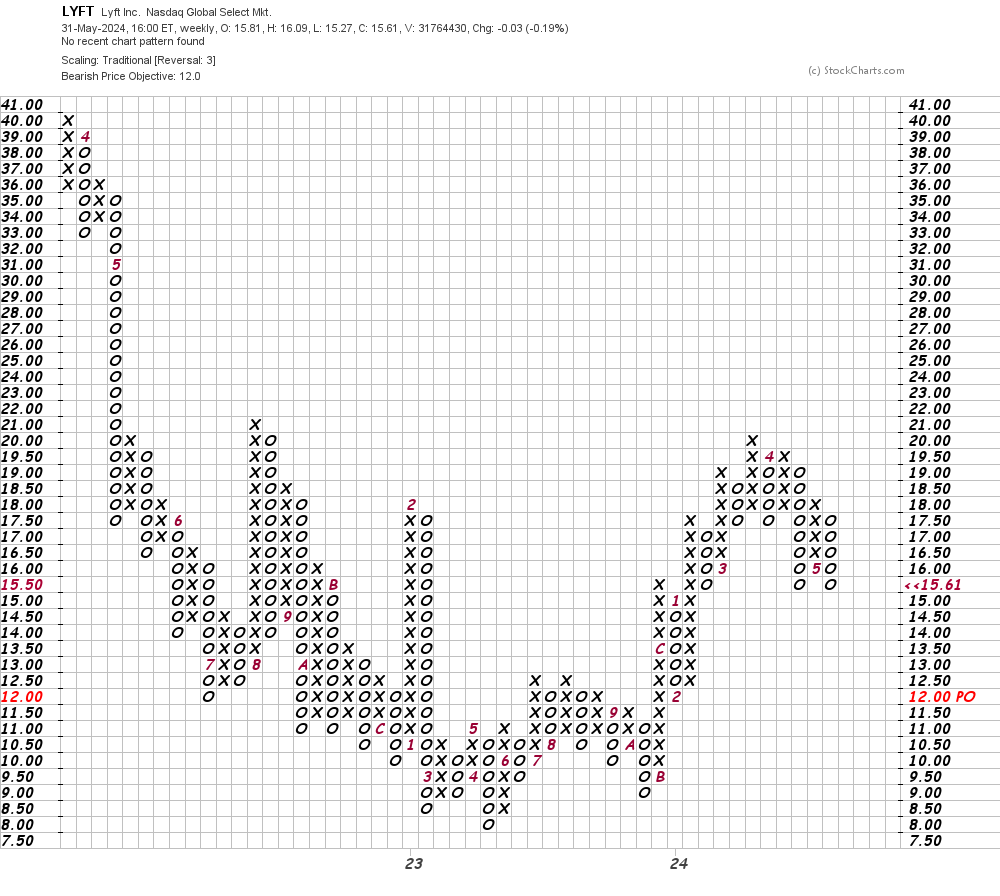
In this weekly Point and Figure chart of LYFT below, I can see the same downside price target of $12.
Bottom line strategy: The charts and indicators of LYFT suggest we could see further weakness in the weeks ahead. Avoid the long of LYFT for now. A bigger base pattern is frustrating but it is a good thing for the longer term.
Employees of TheStreet are prohibited from trading individual securities.