Humana Shares Aren't Looking Healthy
The long-term picture for the healthcare giant isn't encouraging.
You've reached your free article limit
You've read 0 of 1 free Pro articles.
Healthcare provider Humana HUM offers fully-insured medical and specialty health insurance benefits including vision, dental, administrative services and other supplemental health benefits to individuals and employer groups.
Let's check the coverage of the charts and indicators.
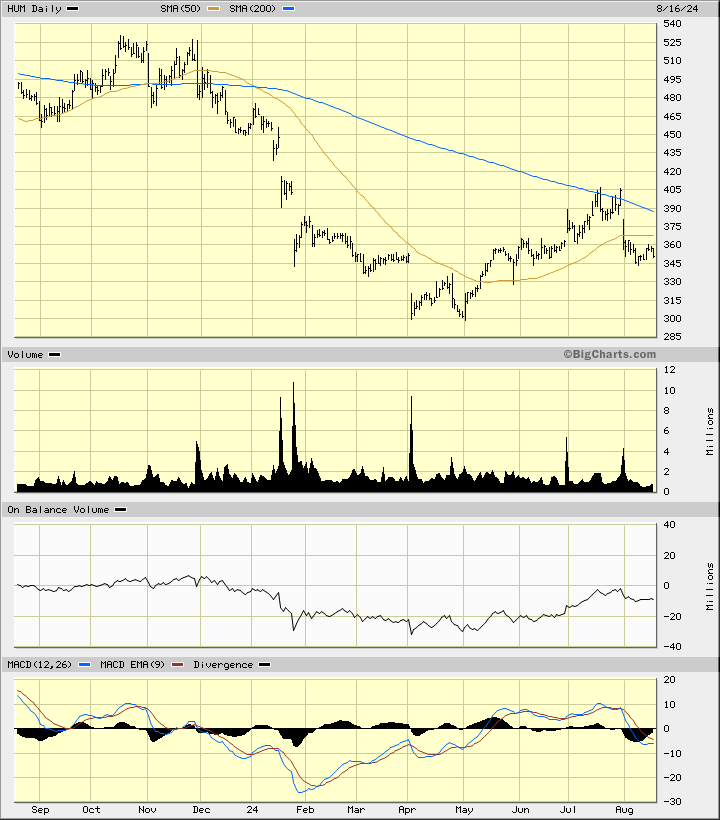
In this daily bar chart of HUM below, I can see that prices rallied from a low in April but failed at the underside of the declining 200-day moving average line in July. HUM now trades below the 200-day line and the 50-day line. The On-Balance-Volume (OBV) line shows only a slight rally from May and has recently turned lower again. The Moving Average Convergence Divergence (MACD) oscillator is below the zero line.
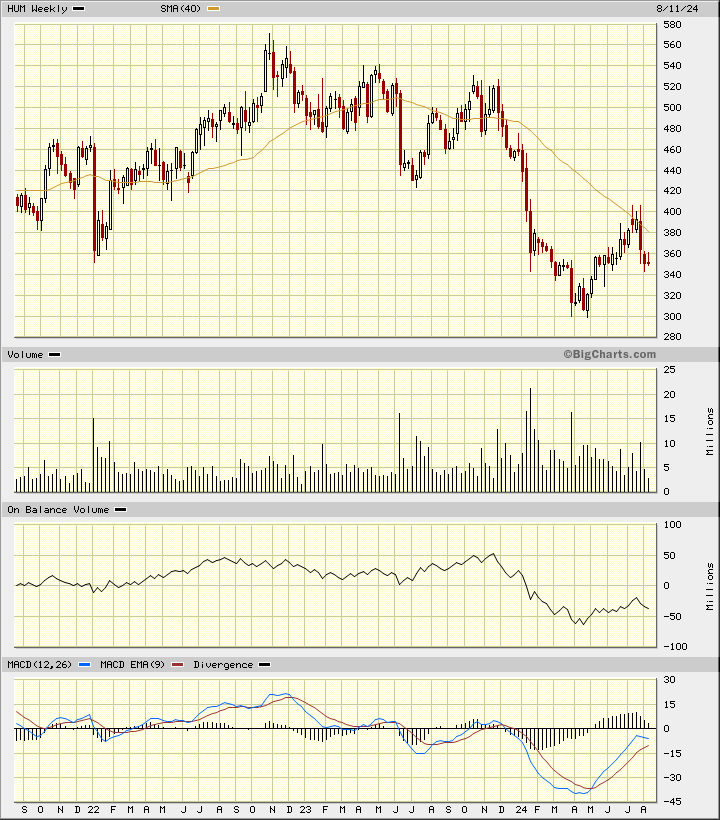
In this weekly Japanese candlestick chart of HUM below, I can see that prices made a big decline from 2022 to early 2024. Prices trade below the declining 40-week moving average line. Notice the upper shadows in July as traders rejected the highs around the intersection of the 40-week moving average line. The OBV line started to turn lower again in July. The MACD oscillator is below the zero line and close to crossing to the downside again.
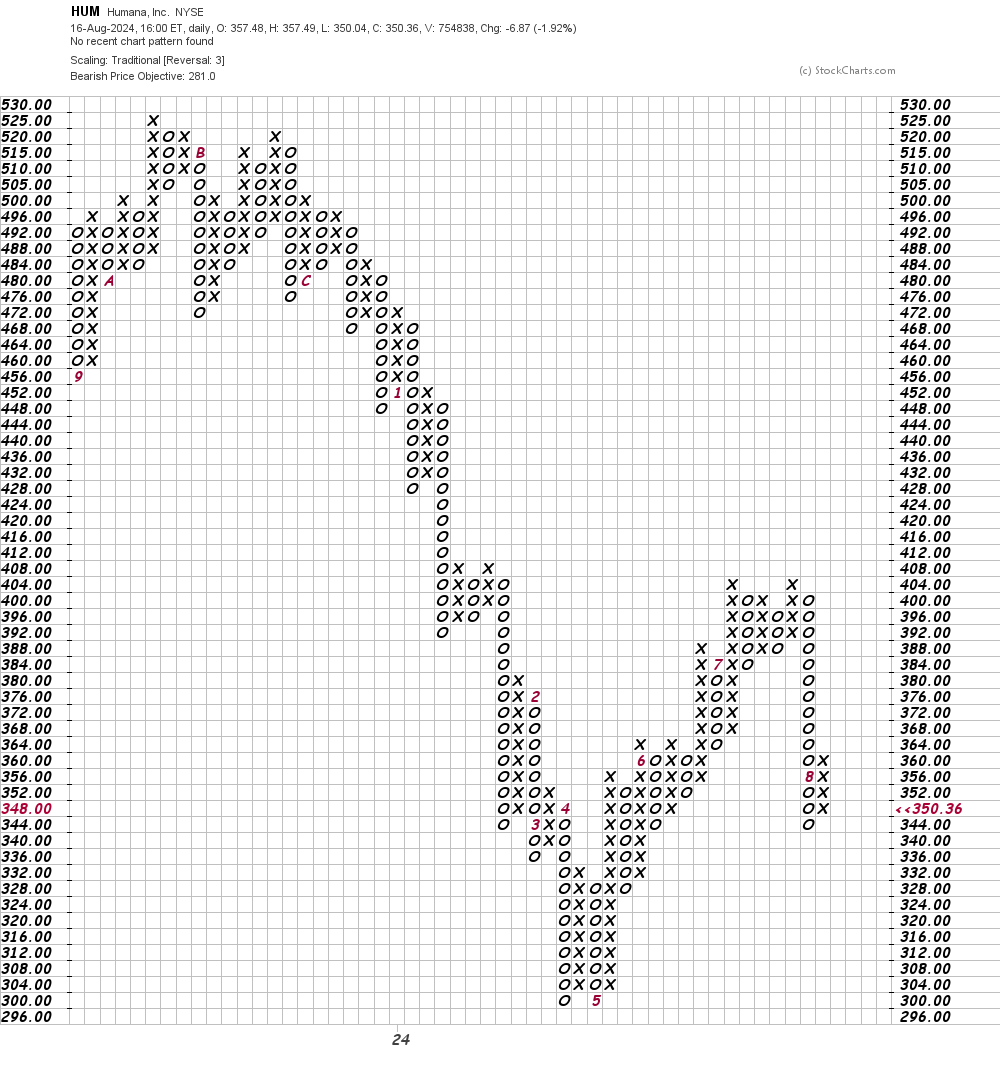
In this daily Point and Figure chart of HUM below, I can see a potential downside price target in the $281 area.
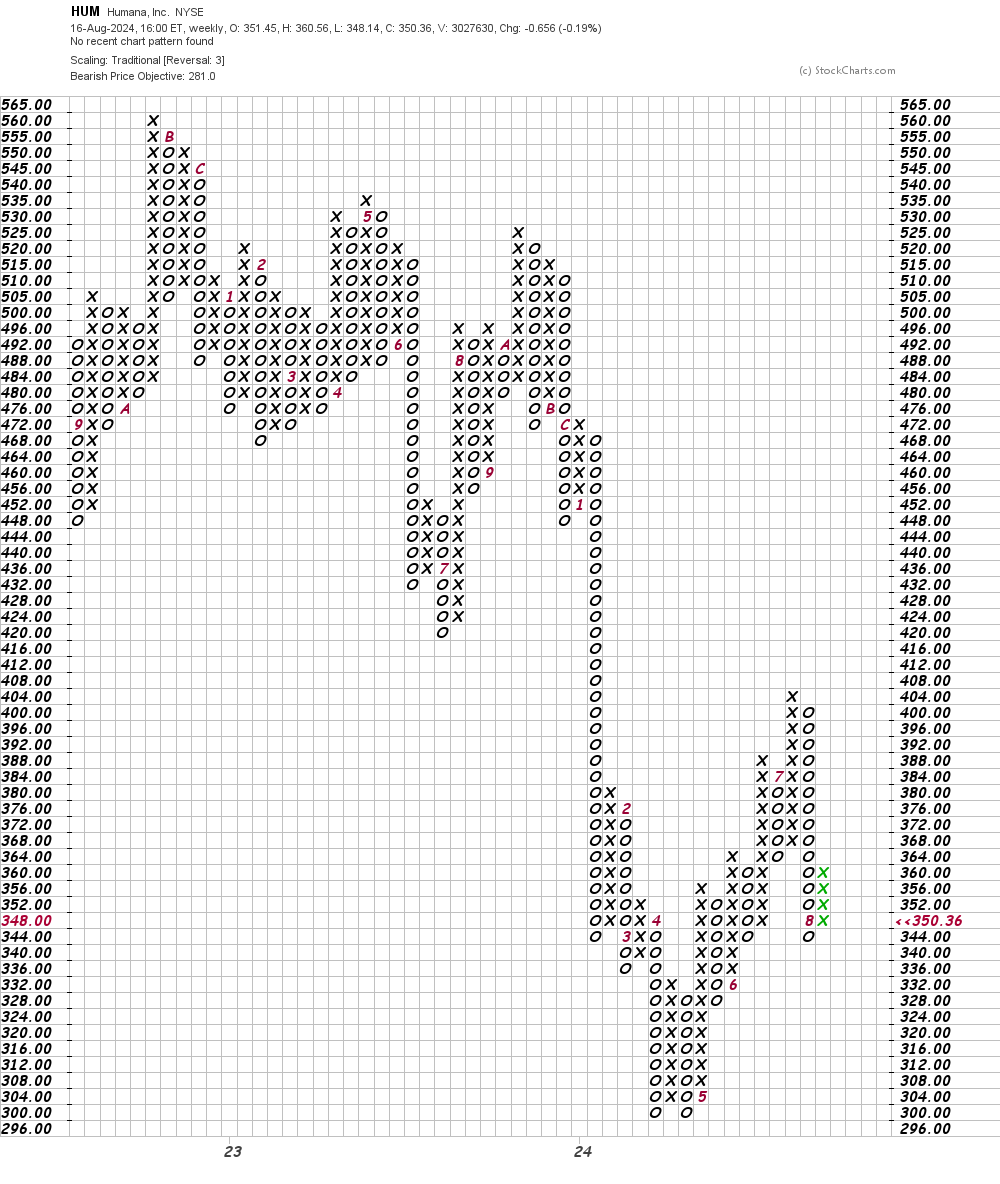
In this weekly Point and Figure chart of HUM below, I can see the same downside price target as the daily chart above: $281.
Bottom line strategy: In the short run, it looks like HUM can bounce a bit but the longer-term picture is not encouraging.
Employees of TheStreet are prohibited from trading individual securities.