How to Play Amazon Without Being Left in the Cold
Let's look at this retail giant as we head into the holidays.
You've reached your free article limit
You've read 0 of 1 free Pro articles.
What do Walmart WMT, The Gap (GAP), The TJX Companies TJX, and Home Depot HD have in common? All of these retailers either cater to consumers on a budget or consumers with a specific need. They have all reported in recent weeks and increased their earnings guidance for the current fiscal year.
But today, we're looking at the online retail king, Amazon AMZN and how to play it.
American consumers, particularly those in middle -- or lower -- income situations have struggled mightily with the inflation-driven affordability crisis in the U.S. and higher interest rates. That said, at least over the past few months, real (relative to inflation) wages have started to rise. Those at the higher end of the income ladder have at least realized an appreciation in asset valuations, which lends itself toward an improved wealth effect across that type of household.
Swollen household debt levels plague a certain number of U.S. households, and delinquency rates, according to data provided by the New York Fed, are on the rise. That said, some readers may have noticed that about a week ago, as reported at Barrons, that ahead of the holiday season, Visa V Chief Economist Wayne Best had revised his holiday season outlook from an increase in spending of 3.8% to an increase of 4%. In that same piece at Barrons, Sharon Zackfia, a five-star rated analyst at William Blair had noted that the top two retailers for Americans shopping for the holidays are Walmart and Amazon. I am long both names.
Online Shopping
According to Adobe Analytics, the first 24 days of what they consider to be the holiday season, starting with Nov. 1, consumers have spent $77.4 billion online. That's more Amazon's bread and butter than it is for its competitors. That's a whopping 9.6% increase from the year ago comp. This also exceeds the pace that Adobe Analytics had projected for online spending for the entire season of $241 billion.
Amazon's Report ...
Amazon had released third-quarter earnings after the closing bell on Halloween. The numbers were good. Amazon's top- and bottom-line results had beaten Wall Street's expectations quite decisively, while net sales growth reflected year over year growth of 11%. North American sales had grown 9%, while international sales were up 12%. AWS segment sales had grown 19%.
Perhaps more importantly, over the trailing 12-month period, Amazon had grown operating cash flow by 57% from the year-ago comparison, while more than doubling free cash flow. I said more importantly, because what was most important was the holiday or "Q4" guidance.
AMZN guided at that time for sales growth of 7% to 11%, which would be $181.5 billion to $188.5 billion, which included an unfavorable impact of roughly 10 basis points from currency exchange rates. Amazon also guided operating income to a range spanning from $16 billion to $20 billion. Readers probably remember that the market reacted well in response to these earnings. That was largely because Wall Street only was expecting something slightly above $13 billion from Amazon on that part of the outlook.
Technicals Going into The Most Wonderful Time of the Year
Readers will see that AMZN broke out from an ascending triangle, which is a bullish pattern, with a $201 pivot back in very early November. That breakout failed, however, and not only tested, but pierced that pivot from above over the past two weeks. Still, support, pressured as it was, appears to have held.
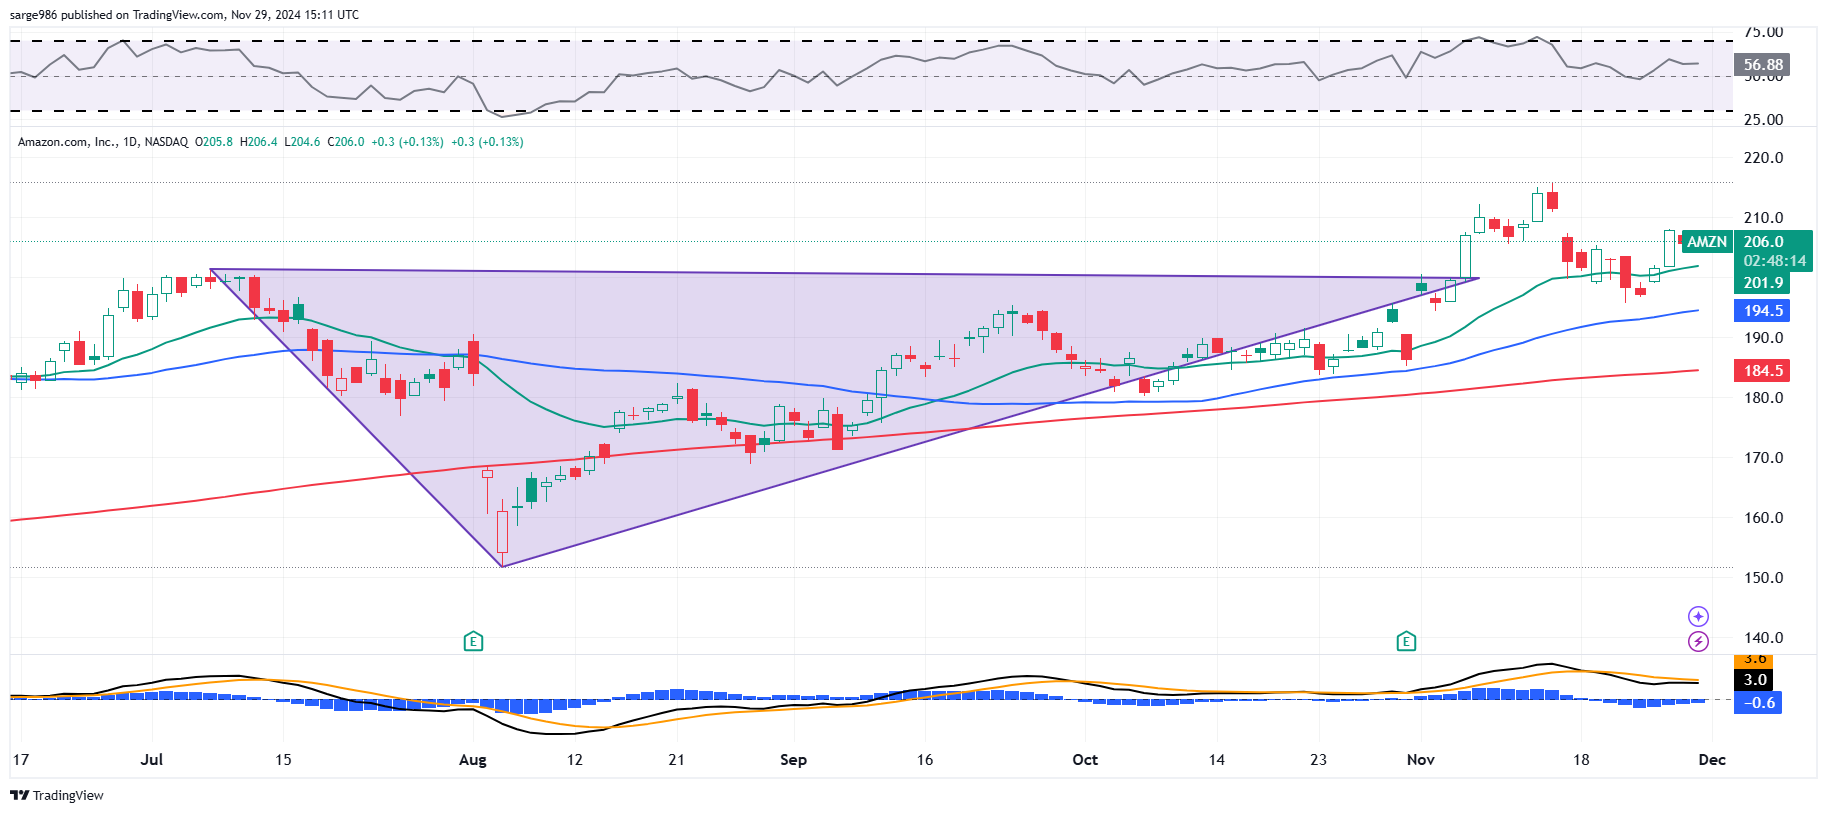
Neither the 50-day or 200-day simple moving averages were threatened, while the real support appeared to be that 21-day exponential moving average, as the swing crowd rallied around AMZN, rather than the actual pivot created by the triangle. Relative Strength is better than neutral, but a long way from being overbought, as the daily moving average convergence appears to be struggling a little.
That said, the histogram of the 9-day exponential moving average is in a better spot than it has been in about a week and a half, while the 12-day exponential moving average has closed in on the 26-day exponential moving average. This set-up is far from being a lost cause, and I still see good reason to remain long the shares. Not counting exchange-traded funds, Amazon is the 12th heaviest weighted allocation at my most active portfolio. This is my plan...
Amazon
Target Price: $241
Pivot Point: $201
Add: From the 21-day EMA (currently $202) down to 200-day SMA (currently $185)
Panic: Loss of the 200-day line.
At the time of publication, Guilfoyle was long WMT, TJX, AMZN equity.
