Here's Why HEICO Is Flying Higher
Can this uptrend continue?
You've reached your free article limit
You've read 0 of 1 free Pro articles.
HEICO Corp HEI is an aerospace and electronics company. Let's check out the charts and indicators to see if the current uptrend can keep going.
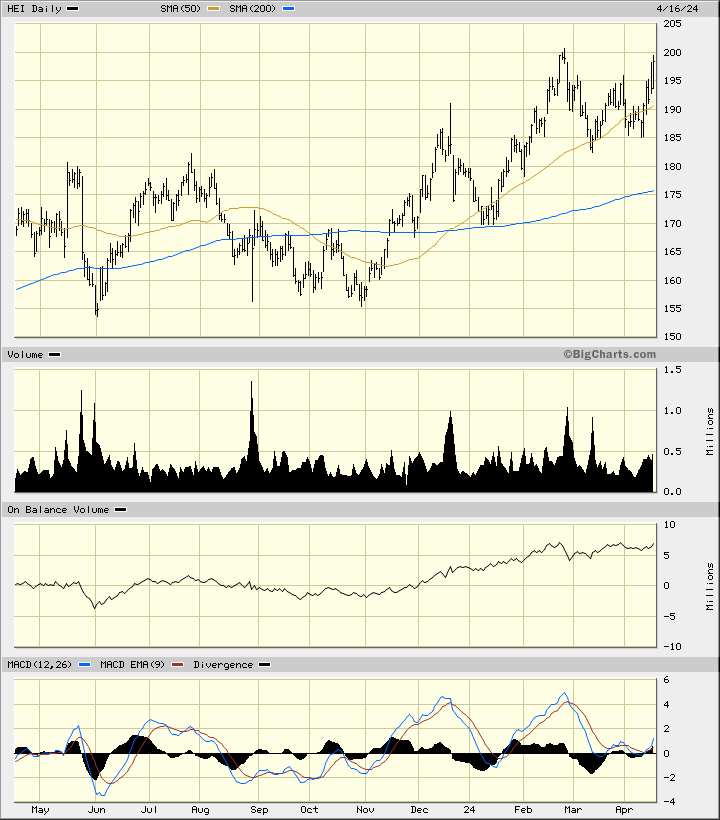
In this daily bar chart of HEI, below, I can see that prices made a base in June-November before starting an uptrend. The uptrend has been supported by a rising 50-day moving average line. The slope of the 200-day moving average line is positive and I can see a successful test of the line in January. In hindsight this dip to the 200-day line was a buying opportunity.
The On-Balance-Volume (OBV) line shows a rising pattern followed by a sideways move more recently. The Moving Average Convergence Divergence (MACD) oscillator is poised to turn higher after hugging the zero line for a few weeks.
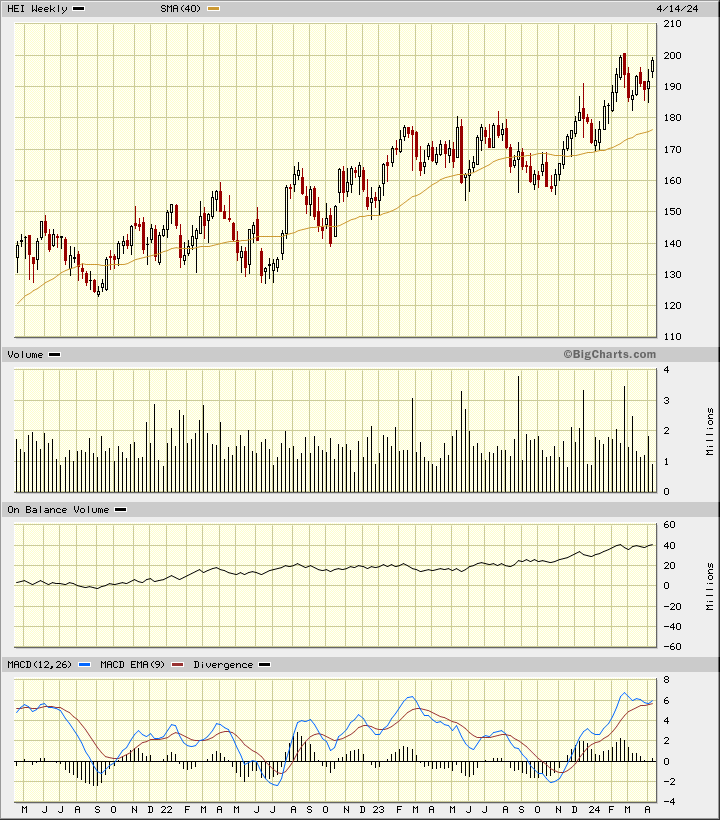
In this weekly Japanese candlestick chart of HEI, below, I can see a three-year uptrend. Prices trade above the rising 40-week moving average line. Trading has been active and tells me that investors are interested in the stock.
The weekly OBV line confirms the price gains. The MACD oscillator is above the zero line but could cross to a take profit sell signal if the rally falters.
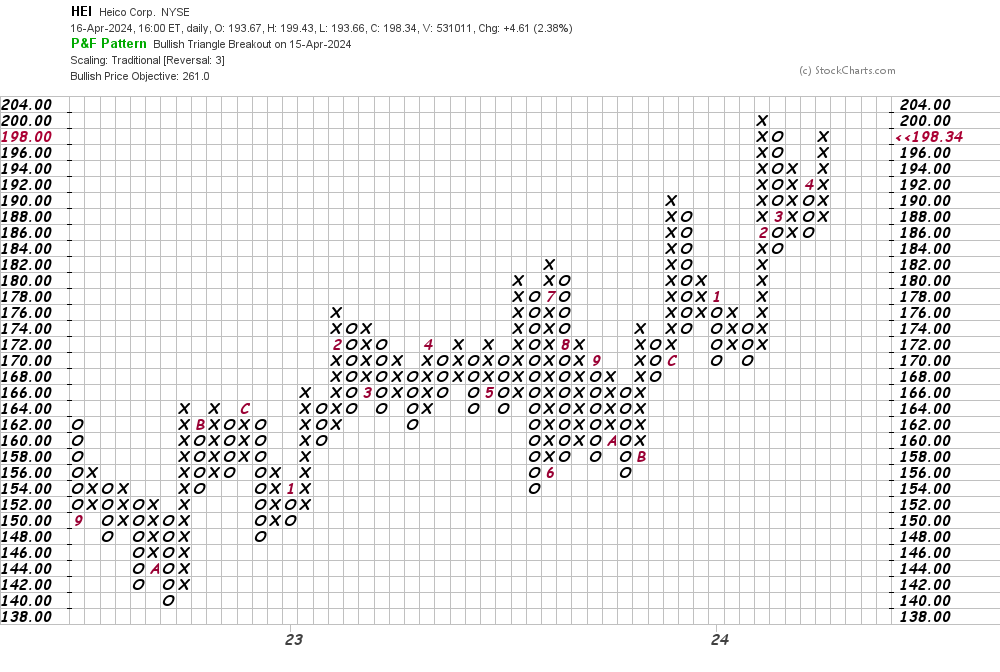
In this daily Point and Figure chart of HEI, below, I can see the software is projecting a price target in the $261 area.
In this weekly Point and Figure chart of HEI, below, I can see a price target of $211 but a trade at $204 or higher should refresh the uptrend.
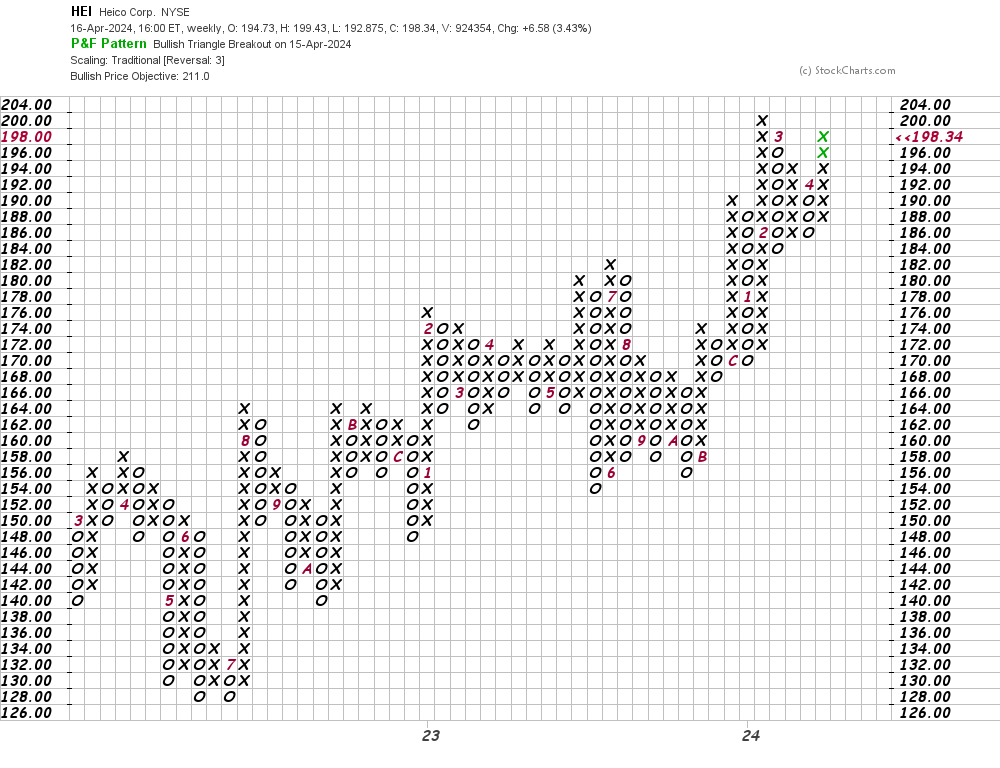
Bottom line strategy: Traders could go long HEI at current levels risking to $190. My price targets start at $211 and go up to $261.
Employees of TheStreet are prohibited from trading individual securities.