Getting Oversold Enough for Santa?
Today makes six straight red days for the Dow. Key sectors have been dropping, too. Will it be enough to set up for an end-of-year rally? Plus, your questions.
You've reached your free article limit
You've read 0 of 1 free Pro articles.
The Market
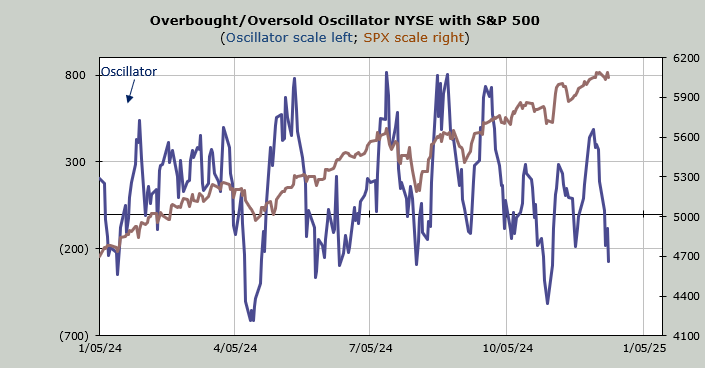
That is six straight red days for the Dow. It is also seven of the last nine days that breadth was negative, and the two up days were +50 and +180, so they may as well have been red, too.
Let me point out the good news in this. When we have a lot of red breadth days, we get to a short-term oversold condition. I have said for a few weeks now I expected the first part of December to see a pullback or market volatility but I also expected that as we get closer to Christmas week, we should be oversold enough for a rally. I still believe that is playing out.
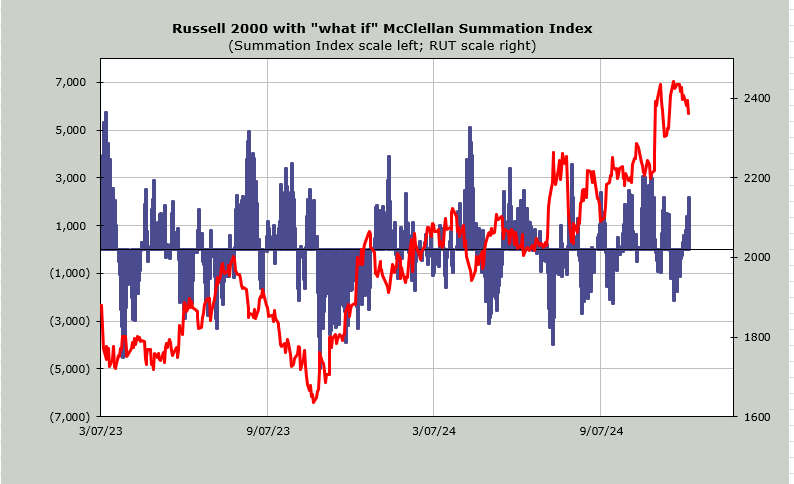
The McClellan Summation Index is heading down (bearish), but it now needs a net differential of +2200 advancers minus decliners on the NYSE to halt the decline. That’s the area that stopped it last month. If we get to +3000 or more, we will be fully oversold. So, another negative day for breadth on Friday would be another step toward that.
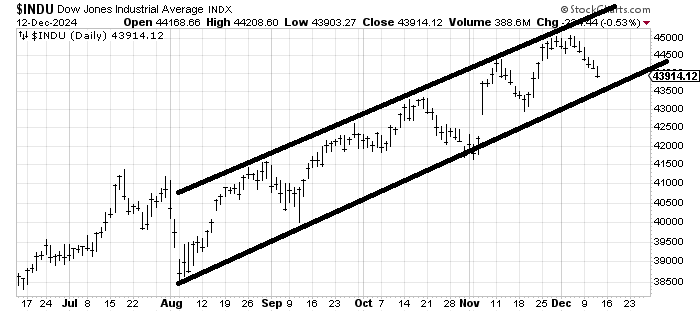
The Dow has been riding this channel since August. With the Dow down eight of the last nine trading days I would expect a push toward that line gives us a bounce.
That Dow chart is not much different than the XLI chart we’ve looked at as well as the Transports (they were red today but are mostly hanging around the last few days) and the Utes (still clinging to 1000).
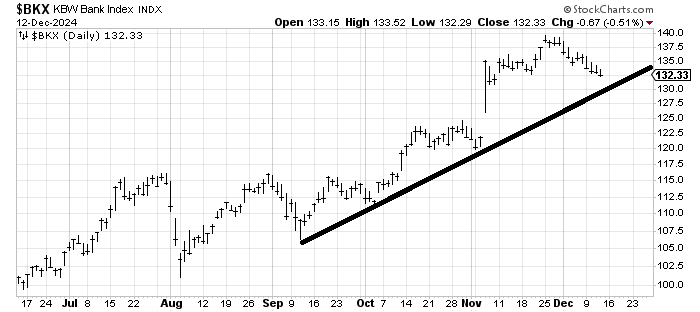
Notice even the Bank Index, which has also hardly had a green day in December, is nearing its uptrend line.
Finally, as awful as the semis have been, I am still looking for a rally to resistance there.
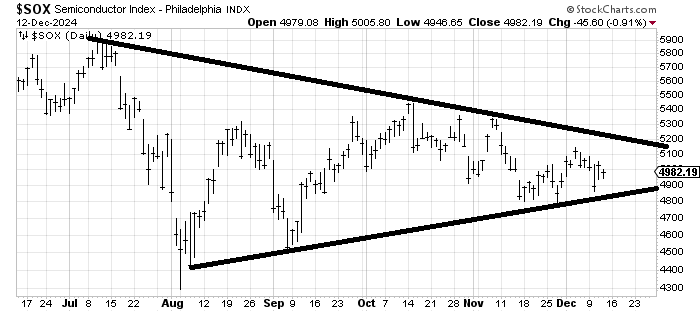
Let me reiterate: if Santa doesn’t come to town and give us an oversold rally that would be bearish.
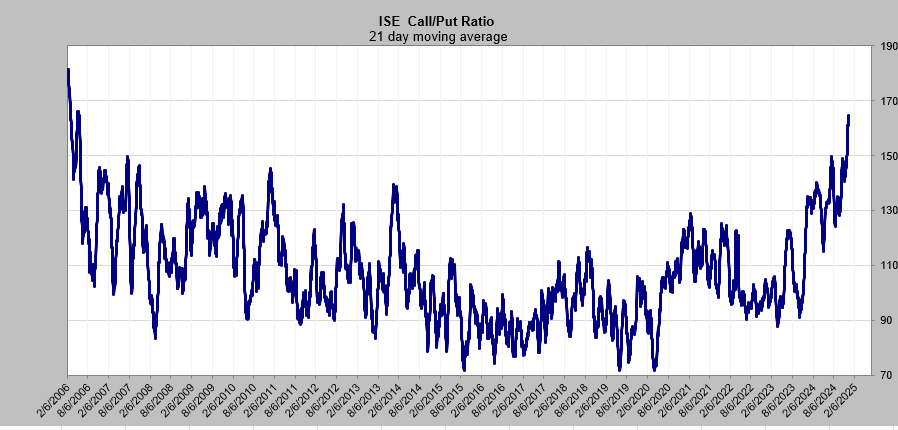
What about after the Christmas rally (provided we get it)? I still believe we are set to have a correction in the first quarter, so don’t fall in love. Something needs to bring that sentiment down. Today the NAAIM exposure got to 99.24 which is the highest since July. But there is also the ISE call/put ratio. I haven’t discussed this much lately because, as you can see, it has gone parabolic. The 21-DMA is now where it was in May of 2006. It was higher in February of 2006 but I’ll be honest I only started keeping the data in January 2006 so that first month or so may be distorted due to the starting point.
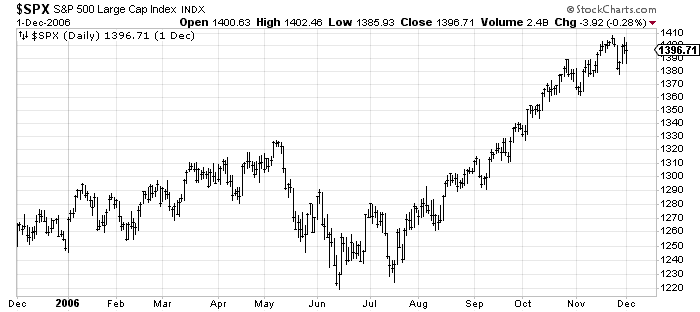
In any event, that’s really high (far too many calls bought relative to puts). Here’s the chart and below it is the chart of 2006. You can see the deep correction we got that began in May of 2006.
New Ideas
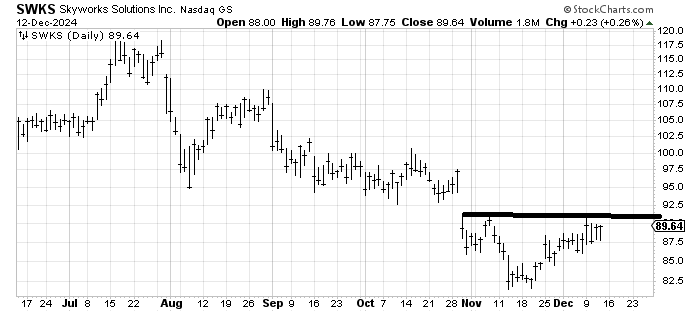
Earlier this week I recommended Skyworks Solutions SWKS. It has had one good day and then nothing. If it can’t get up and over that line (90-ish) in the next few days I would consider that bearish and therefore I am wrong.
Today’s Indicator
The ISE call/put ratio is discussed above.
Q&A/Reader’s Feedback
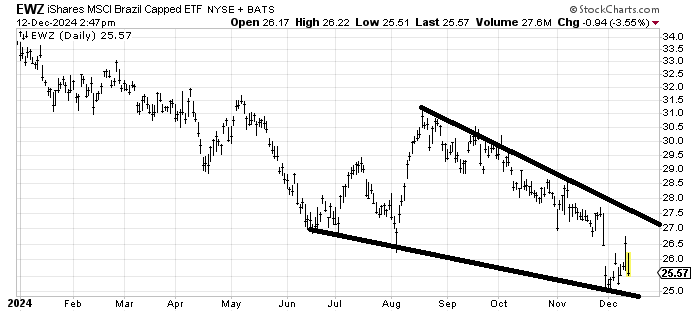
We looked at EWZ recently and I was not a fan and I am still not a fan. Sure it has bounced off that lower line and until that line breaks that’s the pattern but there is an unfulfilled target in the 24 area so if this gets to 24 and tags the lower line at the same time I might be more interested in it, at least for a trade.
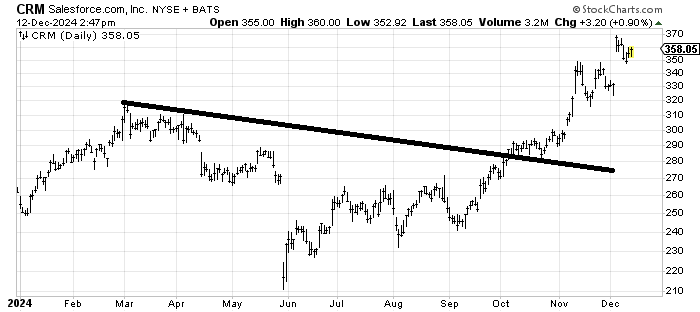
Salesforce.com CRM has an unfulfilled measured target in the 390-400 area but this is not my style chart to chase up here. If it fell to 330 and filled that gap I’d look for a bounce from there. Can it rally into year end? It can but it’s starting to feel late to me.
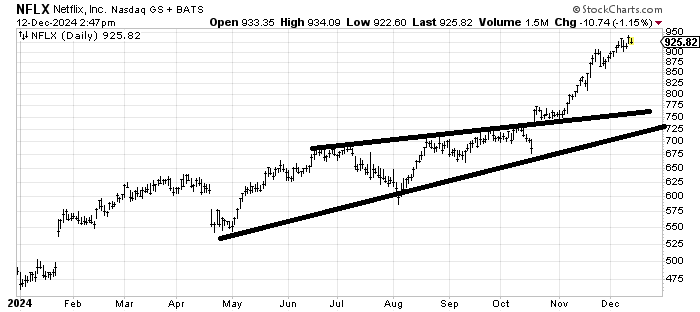
I don’t have another measured target on Netflix NFLX but the stock is getting tired, you can tell because it has spent the last two weeks in the 925 area. Yet it has done nothing wrong. A correction or big sideways would be helpful.
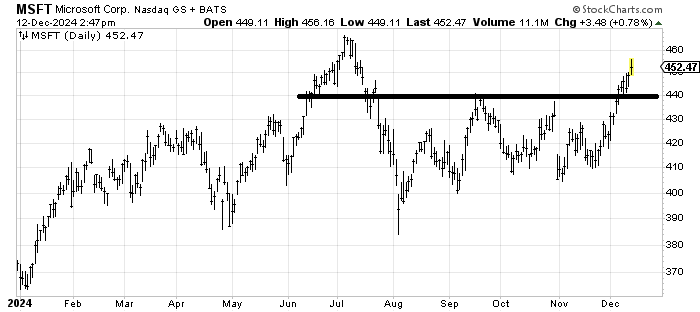
Considering I had thought Microsoft MSFT was in a trading range when we last looked at it, clearly it has done more than I thought it would. That sideways action the last few months measures to the old high. Dips to 440 should be buyable.
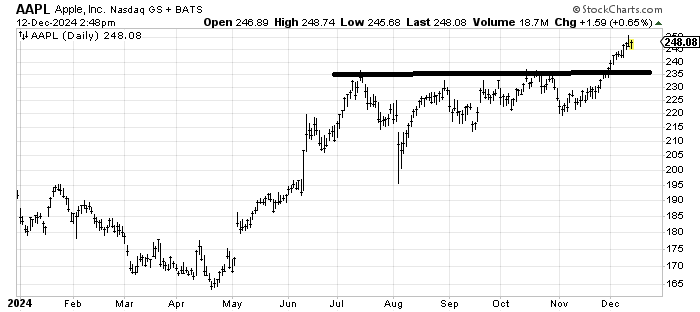
Apple AAPL has a measured target in the 250-255 area. It’s a bit over-extended but not nearly as much as, say, Netflix.