FirstEnergy Looks Fully Charged for Upside
The electric utility also pays an attractive dividend.
You've reached your free article limit
You've read 0 of 1 free Pro articles.
FirstEnergy Corp. FE is an electric utility headquartered in Akron, Ohio. It was established when Ohio Edison merged with Centerior Energy in 1997.
The company pays a nice dividend so let's check and see if the charts are favorable too.
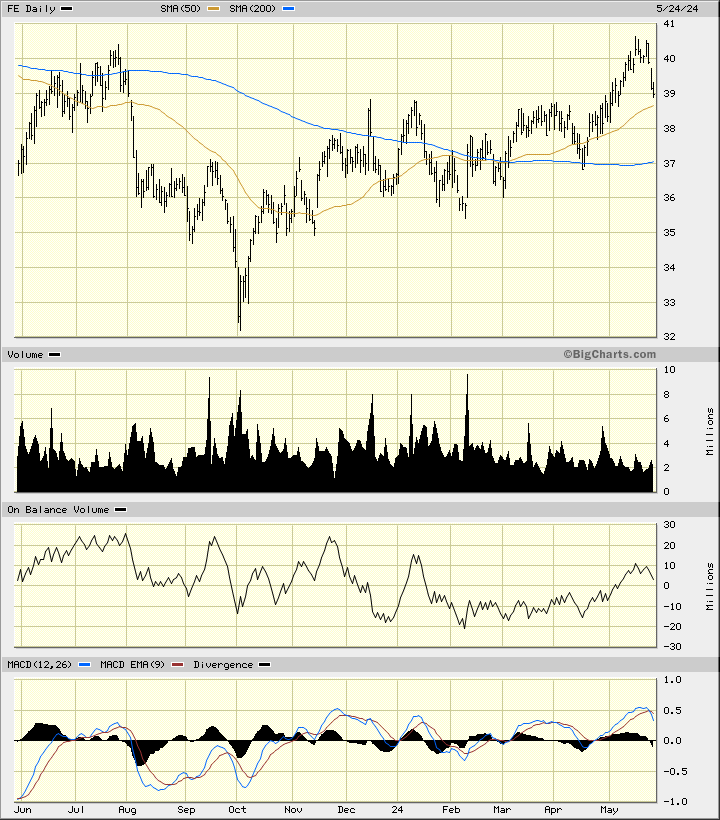
In this daily bar chart of FE, below, I can see that the shares have worked higher since early October. Higher lows and higher highs — the simple definition of an uptrend. FE trades above the rising 50-day moving average line and above the bottoming 200-day moving average line.
The On-Balance-Volume (OBV) line shows some choppy improvement since February. The Moving Average Convergence Divergence (MACD) oscillator is above the zero line but correcting lower.
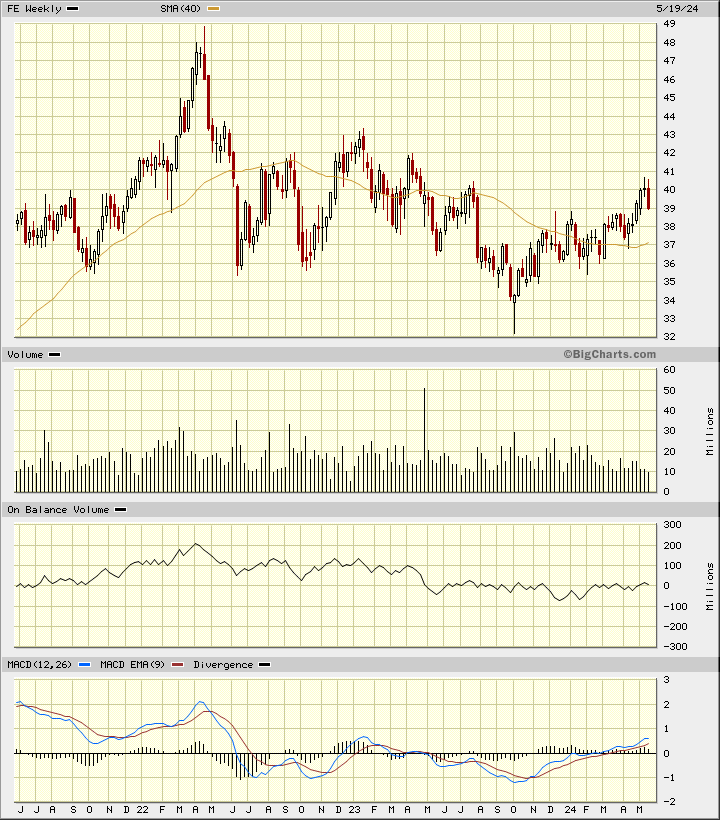
In this weekly Japanese candlestick chart of FE, below, I can see that share prices weakened in 2022 and 2023 before firming into this year. The shares now trade above the rising 40-week moving.
The weekly volume histogram is neutral but the weekly OBV line shows strength this year. The MACD oscillator is in a bullish alignment above the zero line.
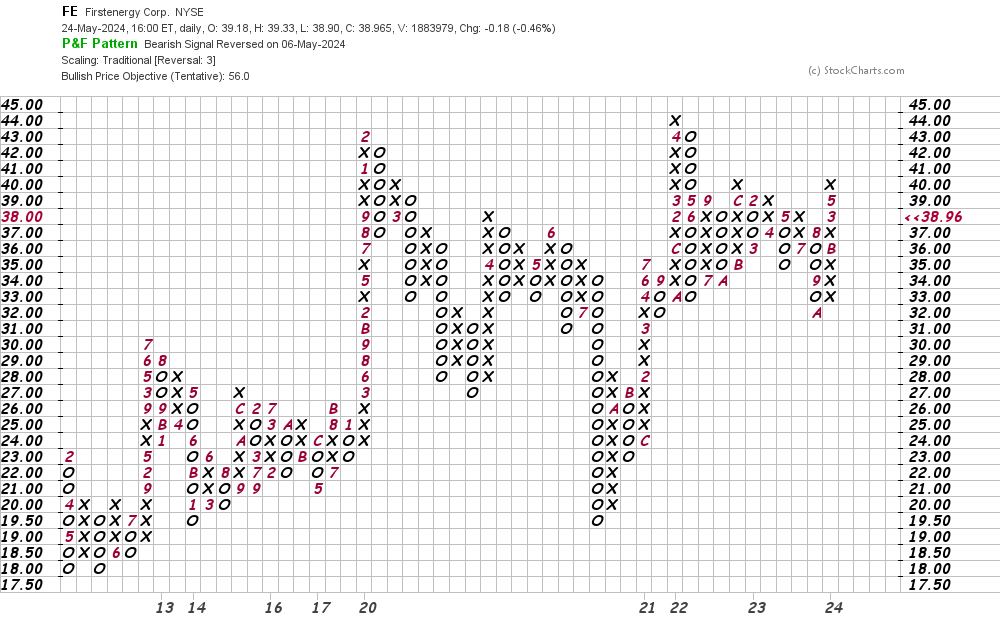
In this daily Point and Figure chart of FE, below, I can see a potential upside price target in the $56 area.
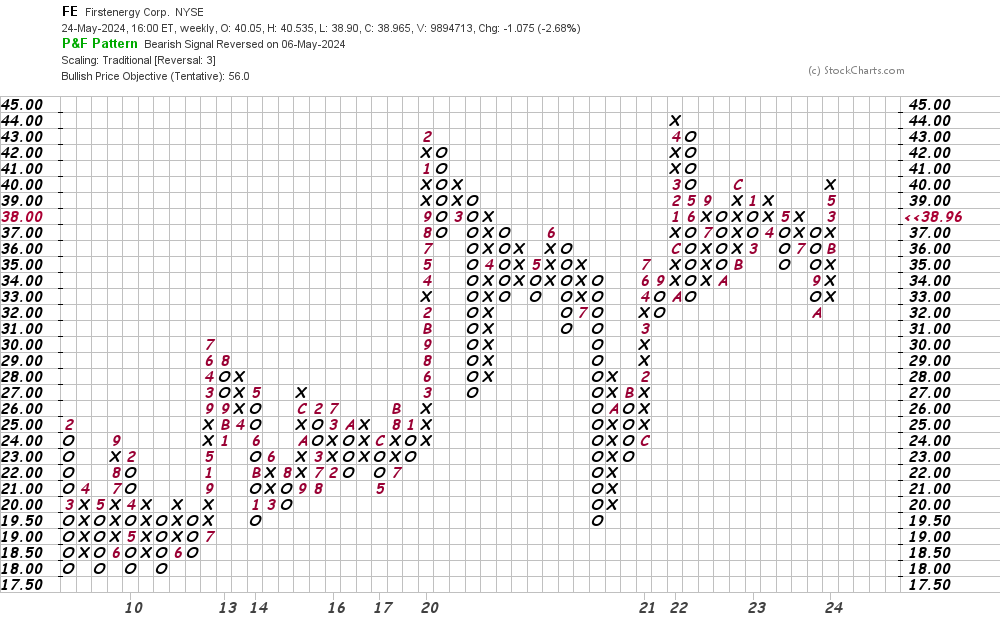
In this weekly Point and Figure chart of FE, below, I can see the same $56 price target shown on the daily chart above.
Bottom-line strategy: Traders could probe the long side of FE at current levels risking to $37, the intersection of the 200-day moving average line. The $56 area is my price target.
Employees of TheStreet are prohibited from trading individual securities.