F5 Stock Hits $200 After a Good Quarter: How to Play It Now
After the 'dramatic' jump Tuesday, there's a smart way to trade the shares.
You've reached your free article limit
You've read 0 of 1 free Pro articles.
F5 Inc. FFIV specializes in application security, multi-cloud management, and online fraud prevention. The company delivered a good quarter and its share price jumped Tuesday.
Let's check on the charts and indicators.
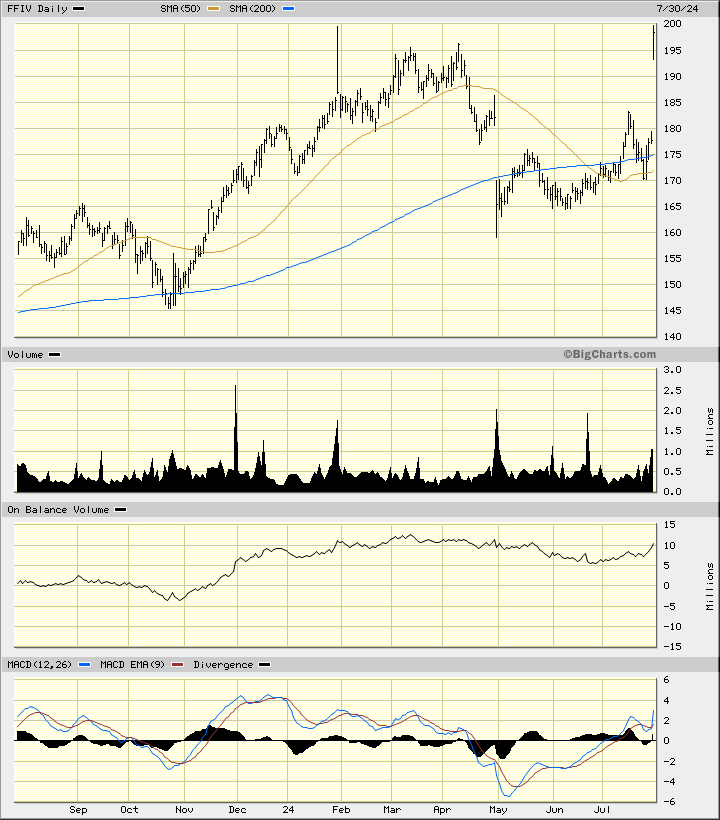
In the daily bar chart of F5, below, I can see that the shares made a pretty dramatic upside price gap Tuesday. FFIV is trading above the rising 50-day moving average line and above the rising 200-day moving average line.
The On-Balance-Volume (OBV) line has been improving since the middle of June. The Moving Average Convergence Divergence (MACD) oscillator is in a bullish alignment above the zero line.
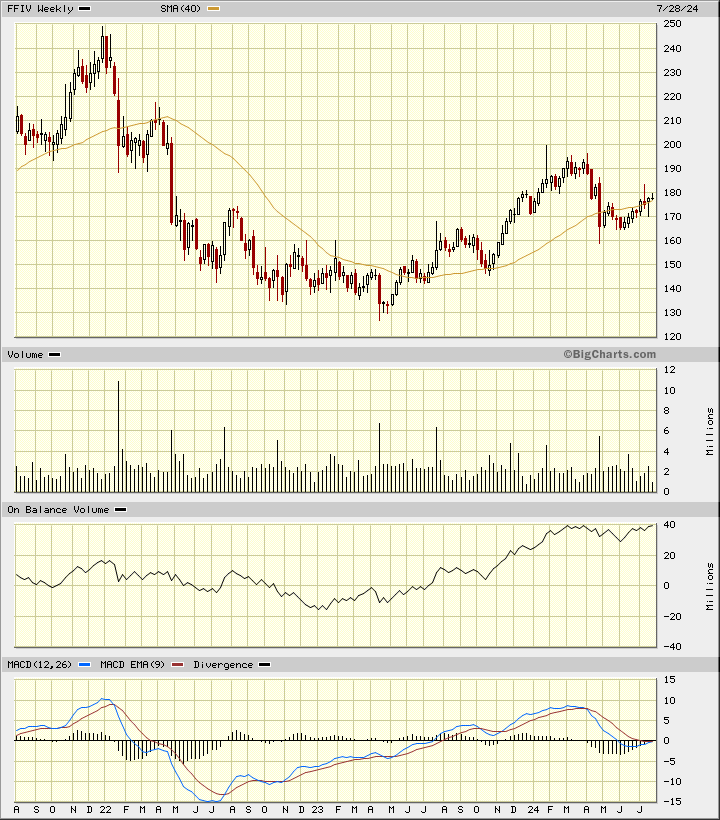
In the weekly Japanese candlestick chart of FFIV, below, I can see a bottom formation. Tuesday's rally will not be plotted on this chart until Friday's close. Meanwhile prices are trading above the rising 40-week moving average line.
The weekly OBV line has been strong since early 2023. The MACD oscillator is back to the zero line but it should turn higher.
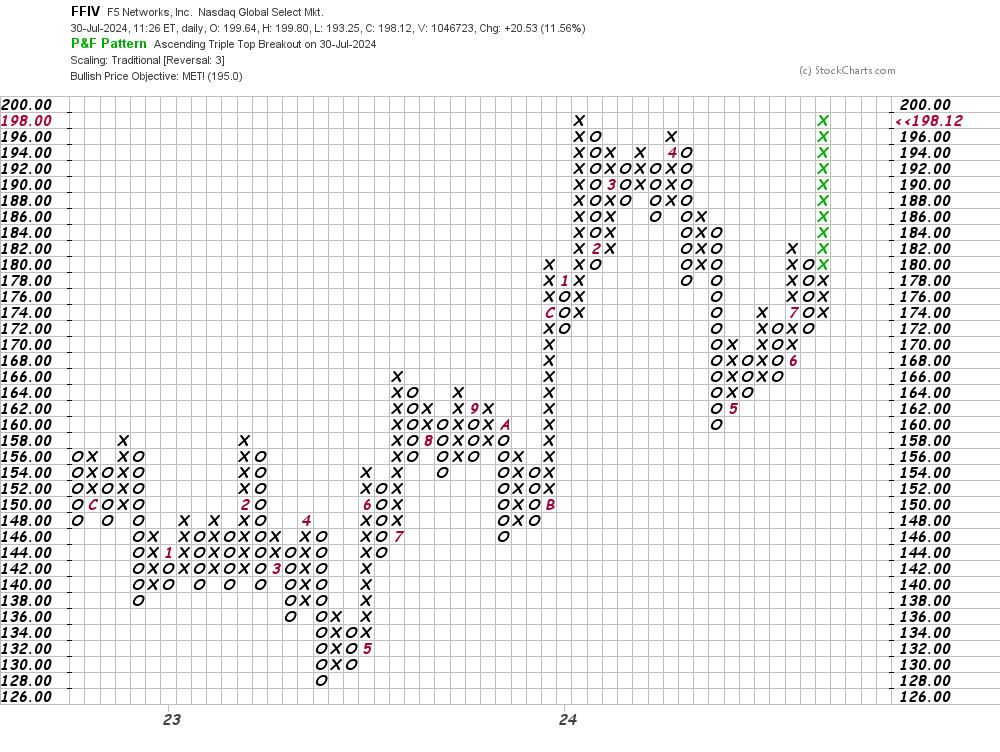
In this daily Point and Figure chart of FFIV, below, I can see that prices reached a price target of $195. A trade at $200 is needed to refresh the uptrend.
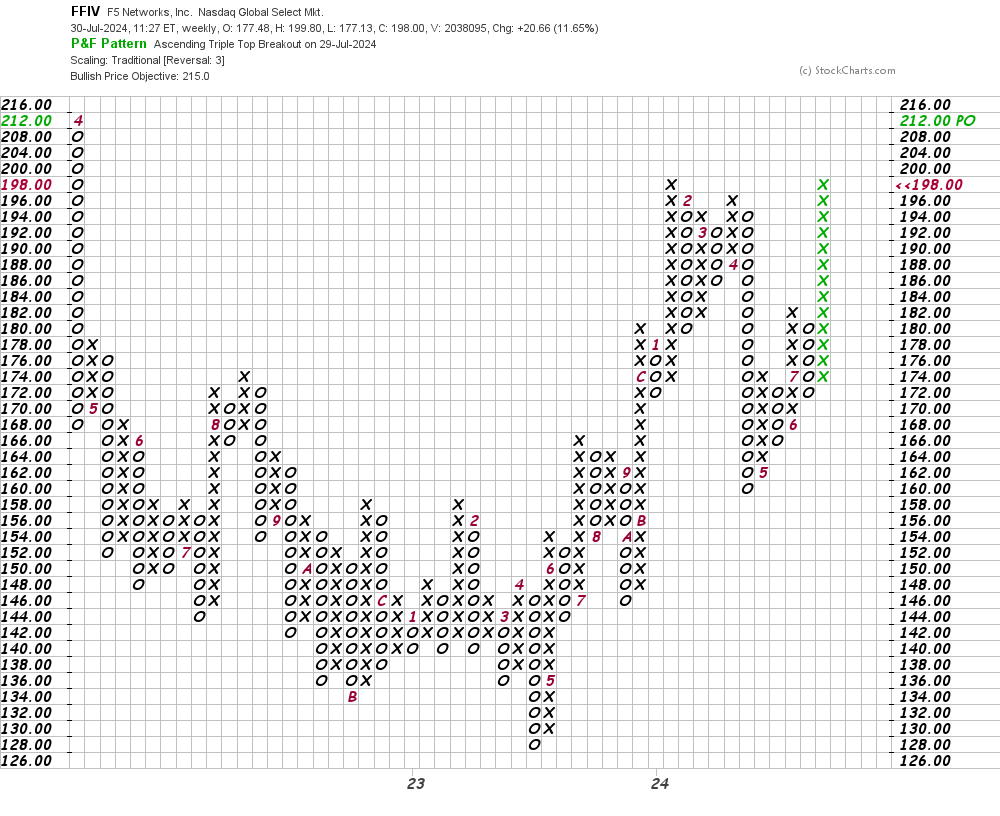
In this weekly Point and Figure chart of FFIV, below, I can see a price target in the $215 area.
Bottom-line strategy: FFIV shares are in need of a rest or a bit of sideways consolidation. Let the stock digest the recent gains and then we'll pick a place to probe the long side.
Employees of TheStreet are prohibited from trading individual securities.