Eastman Chemical Has the Right Mix for Upside
Here's how traders can play the stock's good chemistry.
You've reached your free article limit
You've read 0 of 1 free Pro articles.
Eastman Chemical Co. EMN is primarily involved in the chemical industry making a broad range of advanced materials, chemicals and fibers for everyday purposes.
Let's check out the condition of the charts and indicators.
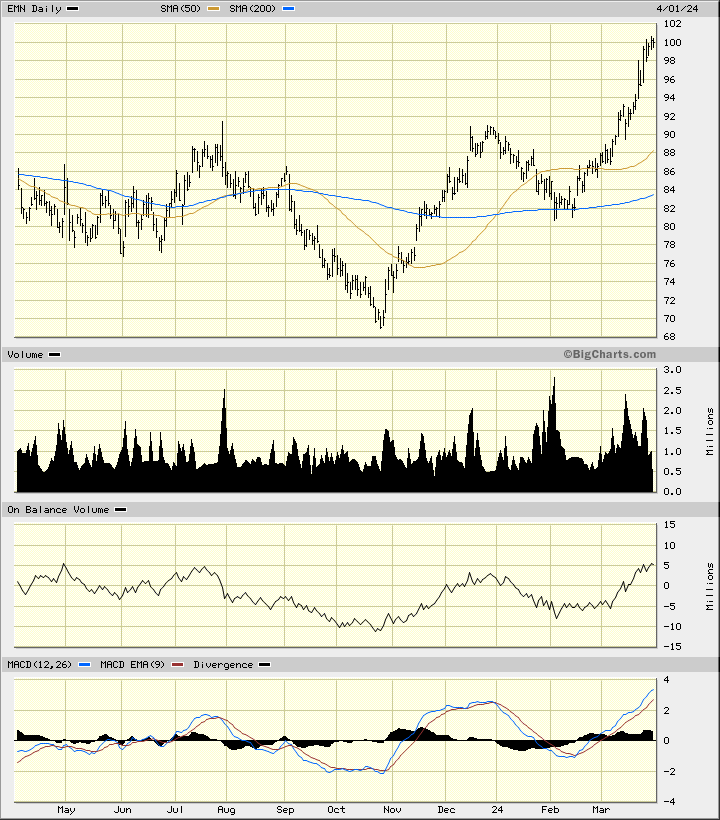
In the daily bar chart of EMN, below, I can see a positive-looking picture. The shares made a low in October and rallied into late December followed by a pullback to the 200-day moving average line. EMN held the 200-day line in February and turned higher again. The shares trade above both the rising 50-day moving average line and above the rising 200-day line.
The trading volume has been more active the past four months and tells me that investors are more interested in this name. The On-Balance-Volume (OBV) line has been rising and moved above its respective December high. The trend-following Moving Average Convergence Divergence (MACD) oscillator is in a bullish alignment above the zero line.
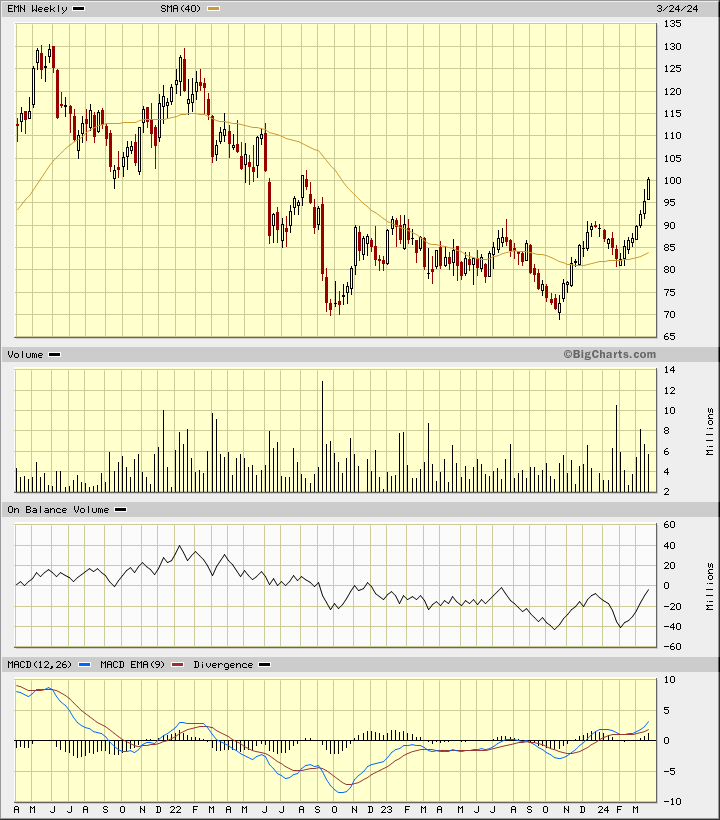
In the weekly Japanese candlestick chart of EMN, below, I can see that share prices made a bottom pattern over the past 18 months or so. EMN trades above the rising 40-week moving average line.
The weekly OBV line is breaking a two-year declining trend and now confirms the price gains we have seen the past six months. The MACD oscillator is above the zero line and rising — just what we want to see from this indicator.
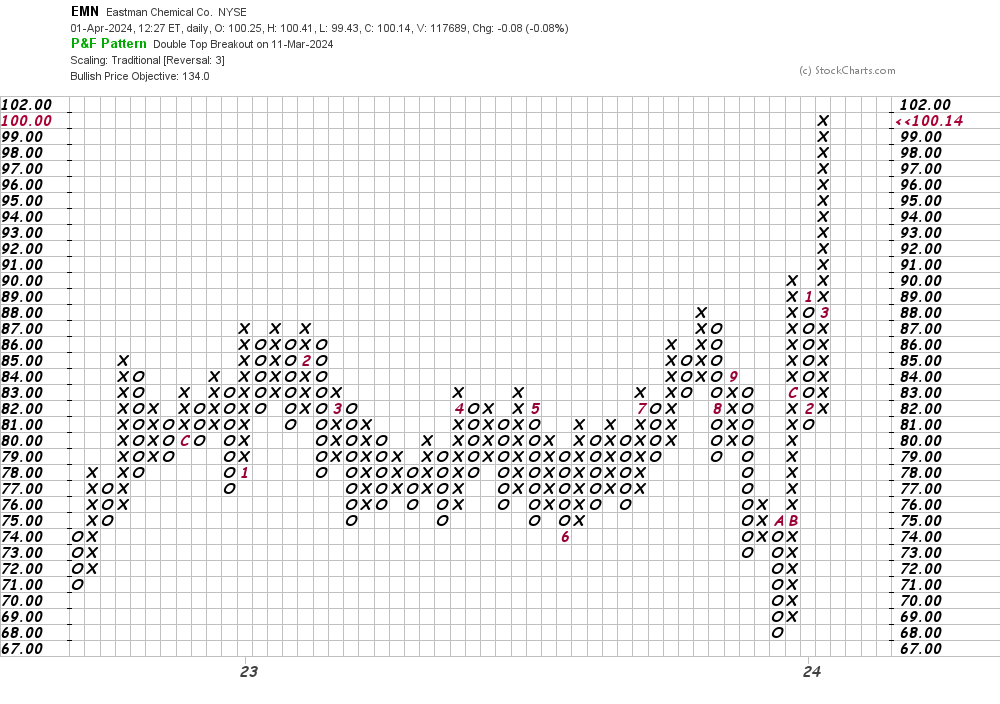
In this daily Point and Figure chart of EMN, below, I can see an upside breakout from a large consolidation pattern. Here the software is projecting a price target in the $134 area.
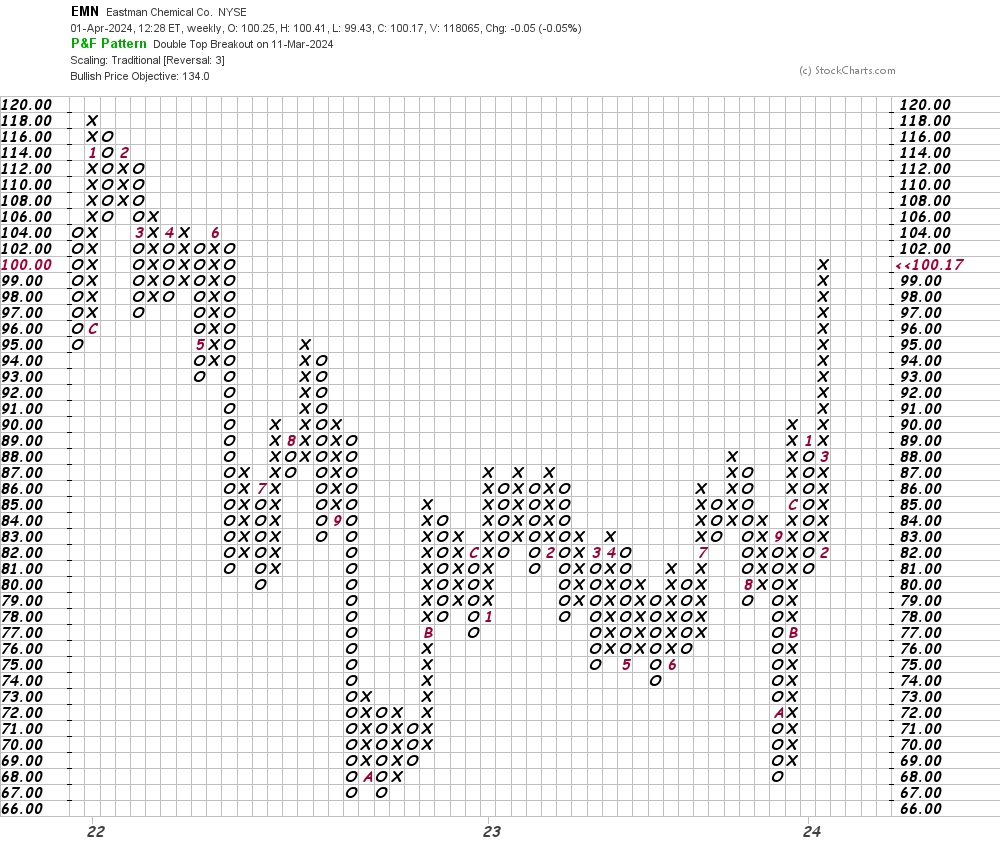
In this weekly Point and Figure chart of EMN, below, I can see the same price target of $134 that is shown on the daily chart above.
Bottom-line strategy: Traders could go long EMN on a pull back into the $98-$96 area. Risk to $91. The $134 area is my price objective.
Employees of TheStreet are prohibited from trading individual securities.