Dollar Tree Has Not Found Its Technical Roots
How low could shares of the discount retailer go?
You've reached your free article limit
You've read 0 of 1 free Pro articles.
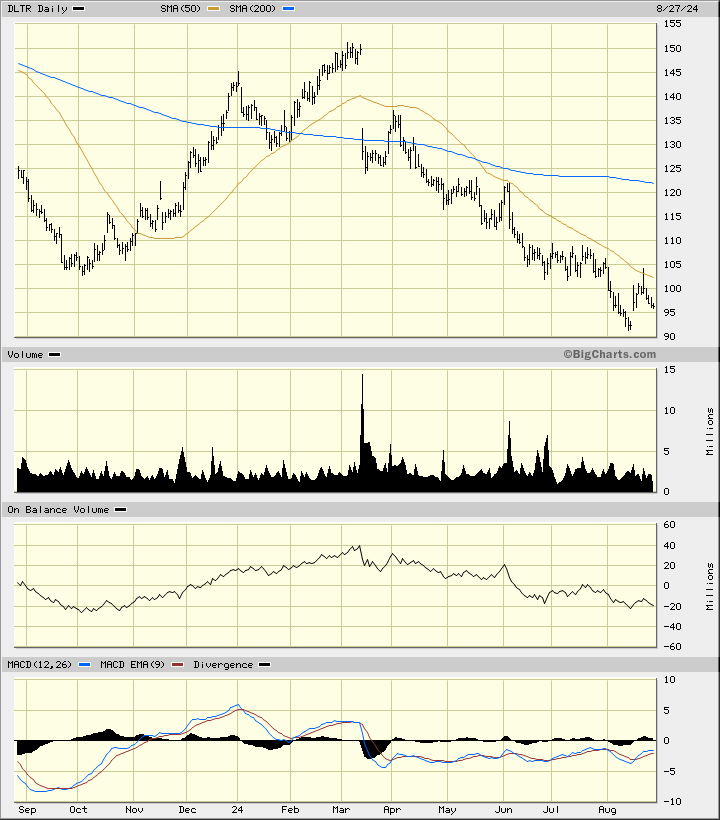
Discount retailer Dollar Tree DLTR has been in a clear downtrend since March and I have not seen evidence of a low or a bottom yet. Let's review the charts and indicators to see when and where investors may return.
In the daily bar chart of DLTR, below, I can see that the shares have spent more time in a decline and short periods of time on intermittent bounces since March. DLTR trades below the declining 50-day moving average line and below the declining 200-day line.
The On-Balance-Volume (OBV) line rose to a high in early March and then started a lengthy decline. The OBV line moves lower when there is more volume traded on days when DLTR closes lower than when it closes higher. This tells me there is more liquidation (selling) than accumulation (buying).
The trend-following Moving Average Convergence Divergence (MACD) oscillator is below the zero line and has been since March.
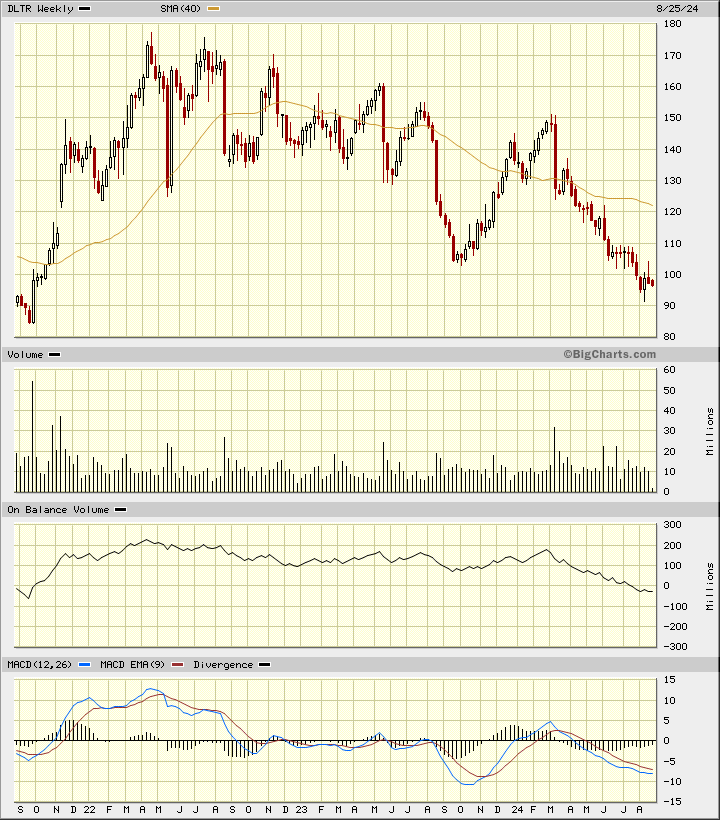
In this weekly Japanese candlestick chart of DLTR, below, I can see that the shares turned lower way back in early 2022. DLTR trades below the declining 40-week moving average line.
The weekly OBV line has been in a decline since early 2022. The MACD oscillator has been bearish for around two years now.
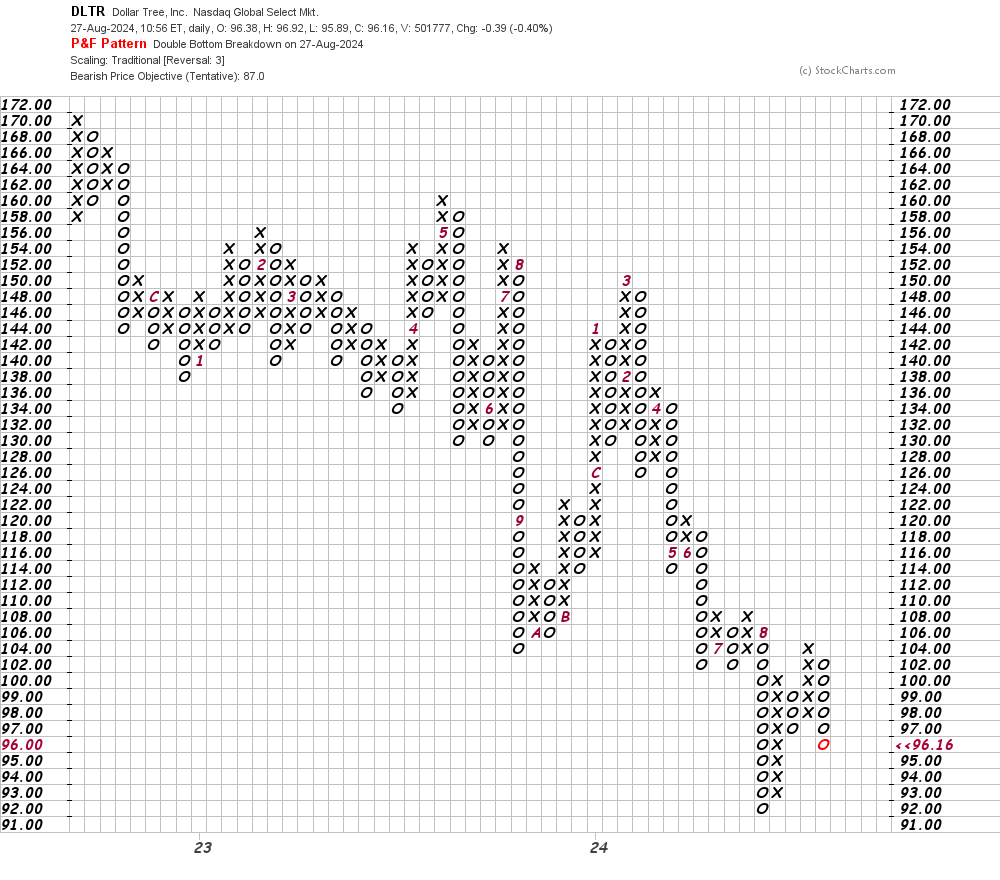
In this daily Point and Figure chart of DLTR, below, I can see a potential downside price target in the $87 area. This would be a new low for the move down.
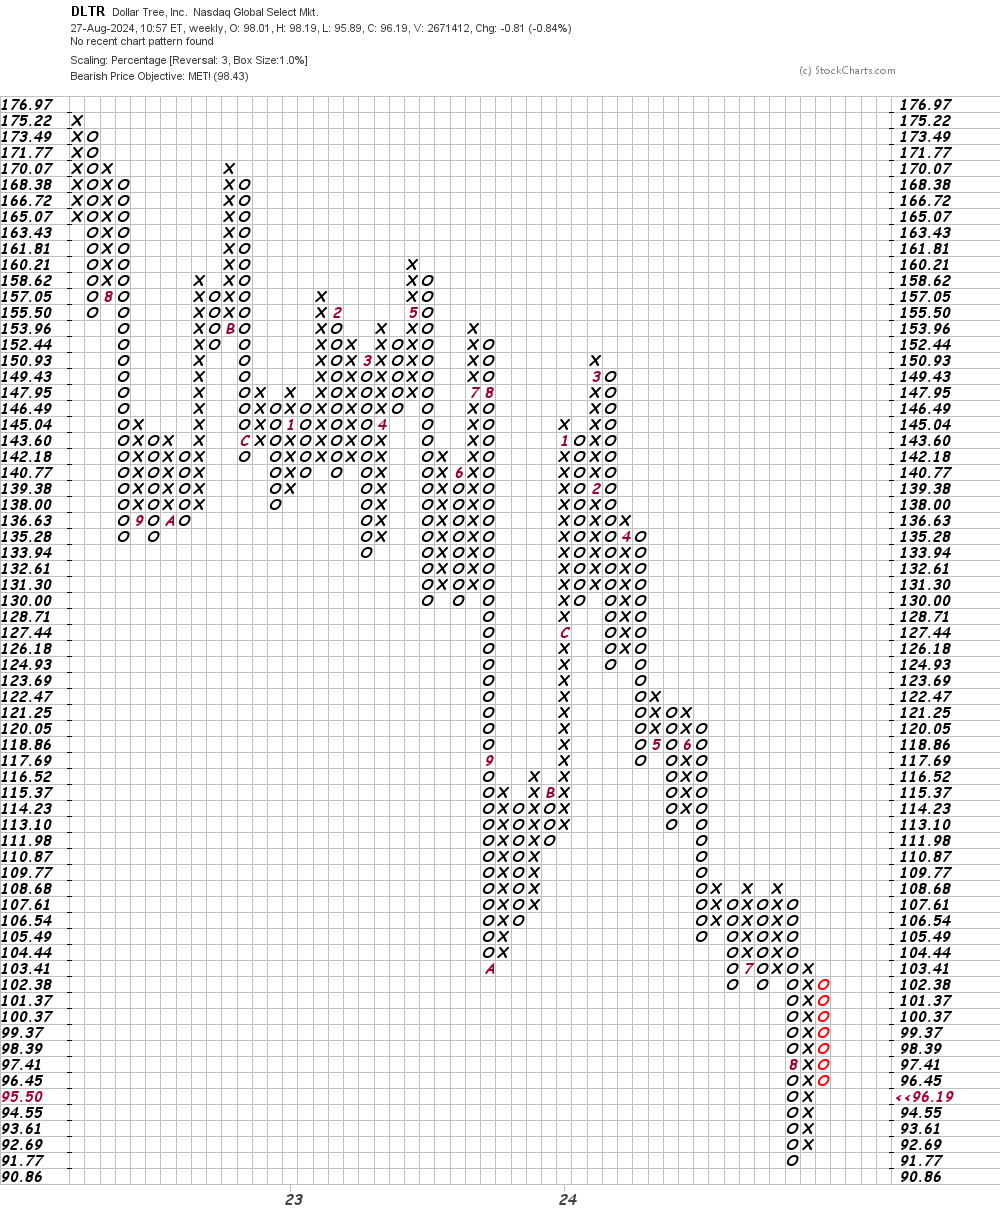
In this second Point and Figure chart of DLTR, below, I used weekly price data. Here the software tells us that the shares reached and exceeded a downside price target in the $98 area.
Bottom-line strategy: You can continue to shop at DLTR but I would not yet consider buying the stock of the company.
Employees of TheStreet are prohibited from trading individual securities.